Data Visualization
Use dynamic visualizations to uncover trends, identify opportunities, and drive better decisions.

Unlock the Full Potential of Your Data with Visualization Tools
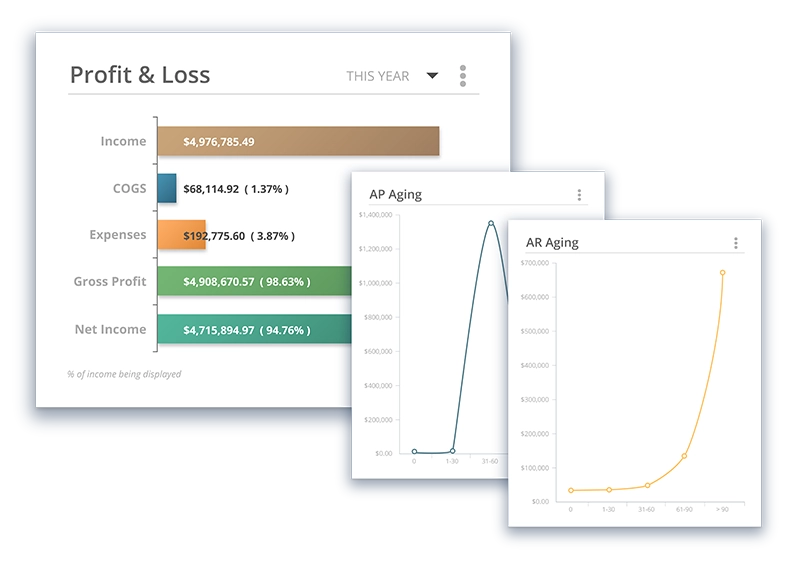
Data visualization turns complex datasets into easy-to-understand charts, graphs, and dashboards, giving you the ability to spot trends, make informed decisions, and communicate insights effectively.
- Customizable Dashboards
- Multiple Chart and Graph Options
- Data Filtering and Drill-Down
- Real-Time Data Sync
What Can Striven Do For You?
Customizable Dashboards
Build interactive dashboards that display real-time data. Customize your dashboards to focus on key performance indicators (KPIs) and metrics that matter most to your business, giving you instant insights at a glance.
Multiple Chart and Graph Options
Choose from a variety of chart types—bar, line, pie, scatter, and more—to visualize your data in the most effective way. This flexibility ensures you can present data in a format that makes the most sense for your audience.
Data Filtering and Drill-Down
Filter and drill down into specific data points to uncover deeper insights. This feature allows you to move from a high-level overview to detailed analysis, helping you make more informed decisions.
Real-Time Data Sync
Ensure your visualizations are always up to date with real-time data syncing. This keeps your charts, graphs, and dashboards current, so you can react to the latest trends and changes in your business.

“Striven has been, by far, the best ERP software I’ve used in 25+ years.”
“Their support has been amazing. “
—Darin B., Business Owner/Founder
Ready to try it? Start here.
Frequently Asked Questions
-
What types of data can be visualized?
+
You can visualize financial data, performance metrics, sales figures, customer trends, project progress, and much more—essentially any data that can be tracked and measured.
-
Can I customize the way data is displayed?
+
Yes, you can fully customize dashboards, charts, and graphs to display the specific KPIs and data points that are most important to your business.
-
How does real-time data syncing work?
+
Real-time syncing automatically updates your visualizations as new data comes in, ensuring that your dashboards and charts are always current.
-
What types of charts are available?
+
The software offers a variety of charts, including bar, line, pie, scatter, and area charts, allowing you to choose the best format to represent your data.
-
Can I drill down into specific data points?
+
Yes, the software allows you to drill down into detailed data points, providing deeper insights and more granular information when needed.
-
Can I create multiple dashboards for different teams?
+
Absolutely. You can create custom dashboards tailored to the needs of different departments, ensuring that each team has access to the most relevant data.
-
Is it possible to export visualizations for reports?
+
Yes, you can export charts, graphs, and dashboards in various formats, making it easy to share data visualizations in reports and presentations.
-
How do data visualizations help improve decision-making?
+
By turning complex datasets into clear, easy-to-understand visuals, the software enables faster and more informed decision-making, helping you spot trends and make strategic adjustments in real time.
Striven's Got You Covered
Whatever your business, Striven is here for you, making your financial management a breeze.
