
Tasks & Projects
Project Management
Support Guide
-
Overview
Project Management is a great tool to utilize when managing workflows, tracking Assignments, and reporting on progress and profitability. This guide will explore how to set up and manage Projects in Striven, including how to configure Project Types, reports, and much more.
Read this guide if you are trying to:
✔ Establish Project Types and create and manage Projects using Assignments, Milestones, and Labels.
✔ Manage a Project using Project Board view, Gantt Chart view, or Milestone view.
✔ Report on Project status and profitability.
-
Project Types
You can use Project Types in Striven to determine how Projects function, including if a Project needs a promise date or if the Project needs review before marking as Done. Below is a screenshot demonstrating how Project Types appear and a list describing what you can accomplish there.
To view Project Types, use the following steps below:
Company → Settings → Projects → Projects Setup → Project Types.
- Project Type Name: The name of the Project Type and will be shown when choosing or editing the type of Project.
- Department(s): Departments selected here will be assigned to Projects of that type.
- Options: Here you have two options available to choose from:
- Needs review before marking done: Notes whether a Project needs to be reviewed in order to successfully mark it as done.
- Needs Promise Date: Allows you to choose to require a promise date on new Projects of this type.
- Default Assignment Category: Notes which category Project Assignments are given by default (Project Manager, Sales Rep, etc.).
- Get Default Assignment from the Customer Level: Once a Customer is selected for the Project, the Assignee will be pre-populated based on the Customer Selected and their Default Assignments. If a Customer has more than one Assignee set with the same Category, the oldest active Assignment will pre-populate in the Project. If there are NO Assignees for a Customer, the field will remain blank.
- Note:This option will not display until a Default Assignment Category is selected for the Project Type.
- Get Default Assignment from the Customer Level: Once a Customer is selected for the Project, the Assignee will be pre-populated based on the Customer Selected and their Default Assignments. If a Customer has more than one Assignee set with the same Category, the oldest active Assignment will pre-populate in the Project. If there are NO Assignees for a Customer, the field will remain blank.
- Default Task Type: Setting a default Task Type will make any Task created within the Project Type to be that chosen Task Type.
- Description: Here you can enter a description of the Project Type.
To add Custom Fields to a Project Type, click the waffle menu that is located next to the Project Type title, and select the Custom Fields button.

Example of Project Type Settings

-
Project Priorities
Project Priorities can help you efficiently organize your Project workload by allowing you to designate certain projects as higher importance than others. You can edit and configure the Project Priorities within your system by navigating Company → Settings → Projects → Project Priorities.
The Project Priorities List will display the Name of the configured Priorities, any added Descriptions, and whether the Priority is the Default. New Priorities can be created by selecting the Plus button from the top of the page.
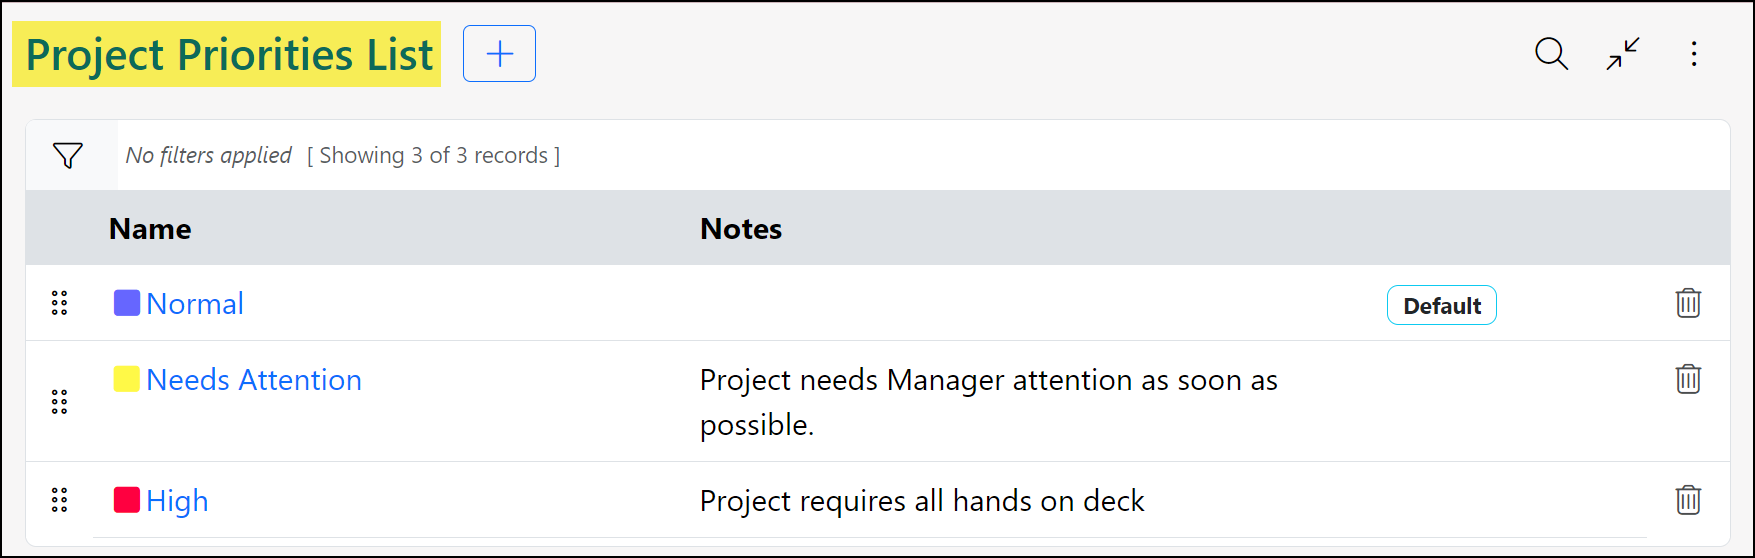
Example of the Projects Priorities List
When adding a new Project Priority, you have the ability to customize your Priority with a several different options:
- Name: Enables you to add a name for the Priority so it may be easily identified.
- Description: Adding a description to the Priority allows you to clarify when this option should be selected.
- Color: You may select a color from a gradient, or use an RGB, HSL, or HEX color code to choose a color for the Priority for a visual representation of the Project’s importance.
- Is Default: Allows you to select whether this Priority is the default for all new Projects.
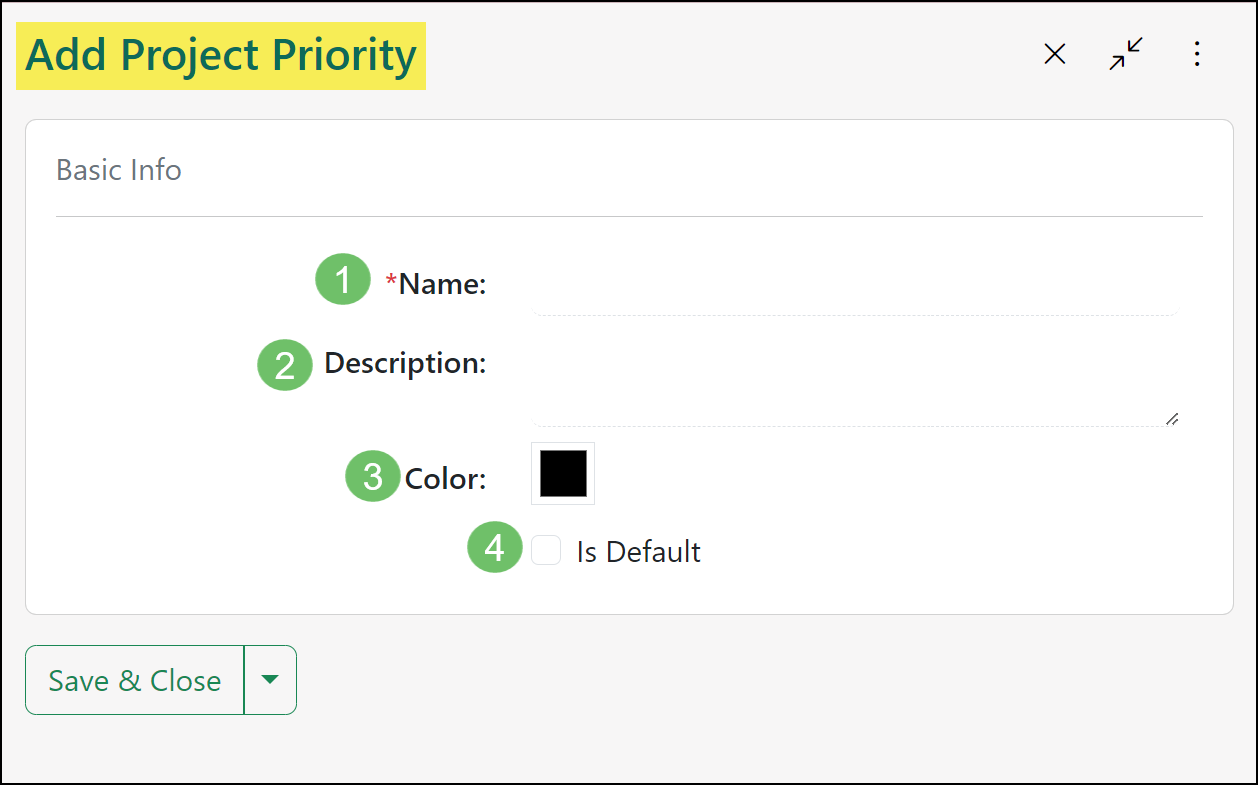
Example of Adding a Project Priority
Using Priorities
A Project may be assigned a new Priority using the Project Info tab from the Project Navigation Menu. The Priority field utilizes a drop-down menu which allows you to choose from your configured Project Priorities.
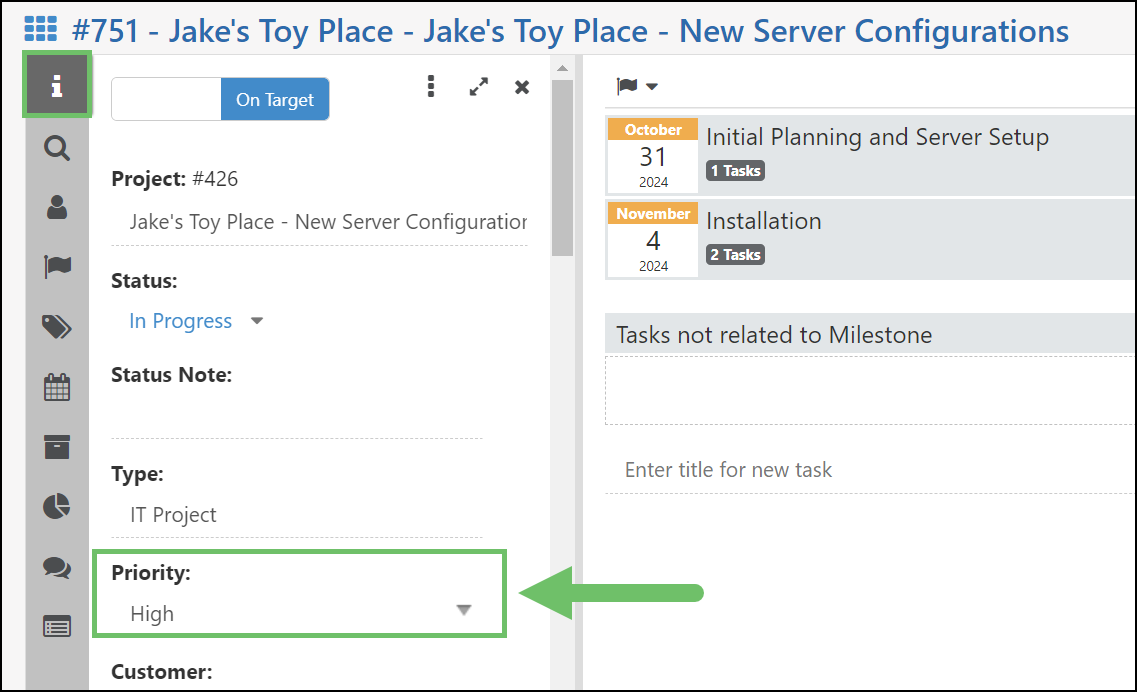
Example of the Project Priority Field
-
Project Integrated Links
Integrated Links in Striven provide a powerful way to connect your projects to external tools and resources, such as shared cloud folders, design assets, external documentation, or client-facing dashboards, directly from the Project page. This ensures your team has instant access to all relevant Project assets without leaving their workflow.
Configuring Project Integrated Links
Before Integrated Links can be utilized on individual Projects, they must first be configured within your global system settings. To set up Integrated Links for Projects, navigate to the following path: Company → Settings → Company → Customizations → Integrated Links.
From the Entity Type drop-down menu, select Projects. Click the Add button to begin creating a new link configuration.Configure the following fields in the setup window:
- Link Name: Enter a recognizable title for the link (e.g., Project Google Drive, Figma Board, Slack Channel).
- Description: Enter a detailed description of what the Integrated Link will navigate the user to.
- Link URL: Enter the base URL for the external destination.
- Merge Fields: You can insert dynamic Merge Fields (such as Project ID, Project Name, or Customer Name) into the URL structure to create context-aware links that automatically navigate to the correct project-specific external page.
- Icon: Use the standard favicon or select an icon to represent the link visually on the project interface.
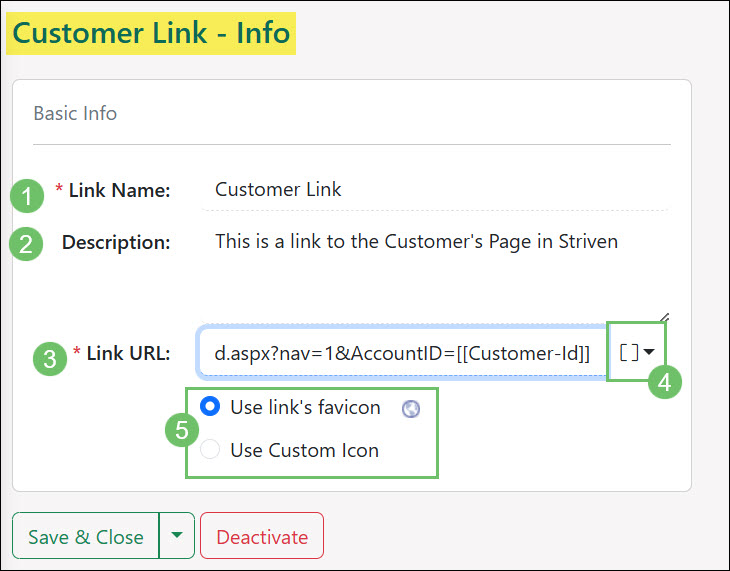
Example of Creating a Project Integrated Link
Using Integrated Links on Projects
Once an Integrated Link has been configured for Projects, it will automatically become available across your project records.
To view and interact with your Integrated Links navigate to Projects → List and select a project to open the Project Info page. Look at the Left Navigation Menu of the Project Info section.
Your configured Integrated Links will display as clickable icons. Clicking an icon will seamlessly launch the target URL in a separate browser tab, allowing your team to jump directly to external project resources while preserving their active Striven workspace.
Example of an Integrated Link from the Project Info Page
-
Creating a Project
Projects can be created using a variety of methods. One is by using the Quick Add menu option found next to the Dashboard button on the top right of your Striven page, or by clicking the Add button on the Projects List page, which will populate the Add Project screen. Projects can also be copied in order to duplicate settings from an existing Project.
Within the Add Project screen, the only required field is the Project name, but a Customer and Customer Contact can also be added. The Project Manager can be designated here as well. Below is a screenshot demonstrating how the Add Project page appears.
To view the Add Project page, navigate through:
Projects → List, then click the Add button.
Example of Adding a Project
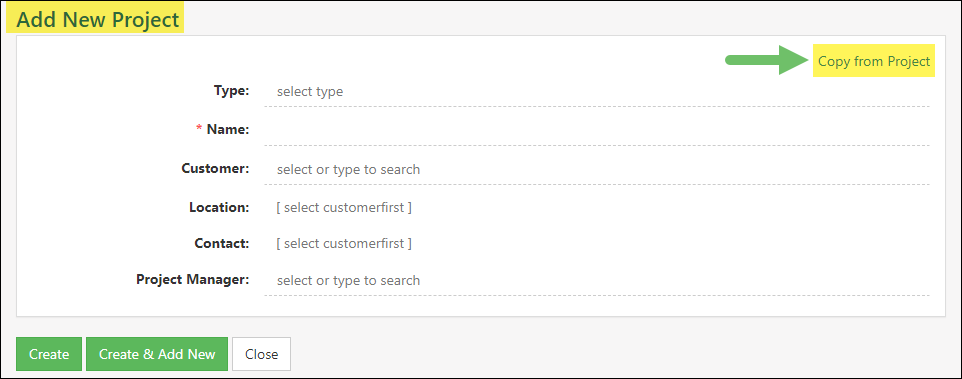
Copy from Project
Another handy feature on the Add Project page is the option to Copy from Project in the top right corner of the Add Project Info box. This link allows you to select an existing Project from which you wish to copy the details to your new Project. In doing so, the new Project will pre-populate with the Project Type, Name, Customer, Location, Contact, Project Manager, and Start/End Dates from the existing Project. You will also have the option to copy Milestones, Assignments, Custom Statuses, Tasks, Labels, Task Statuses, Hub Contents, and Hub Content Groups from the existing Project.

Example of Using the Copy From Project Feature
-
Project Views
The Project Board is a way to view Tasks in a Project organized by Task Status, commonly referred to as swim lanes. Labels, Budgets, and Assignments are visible in this view, and each status represents where the Task is in its progression.
-
Project Board
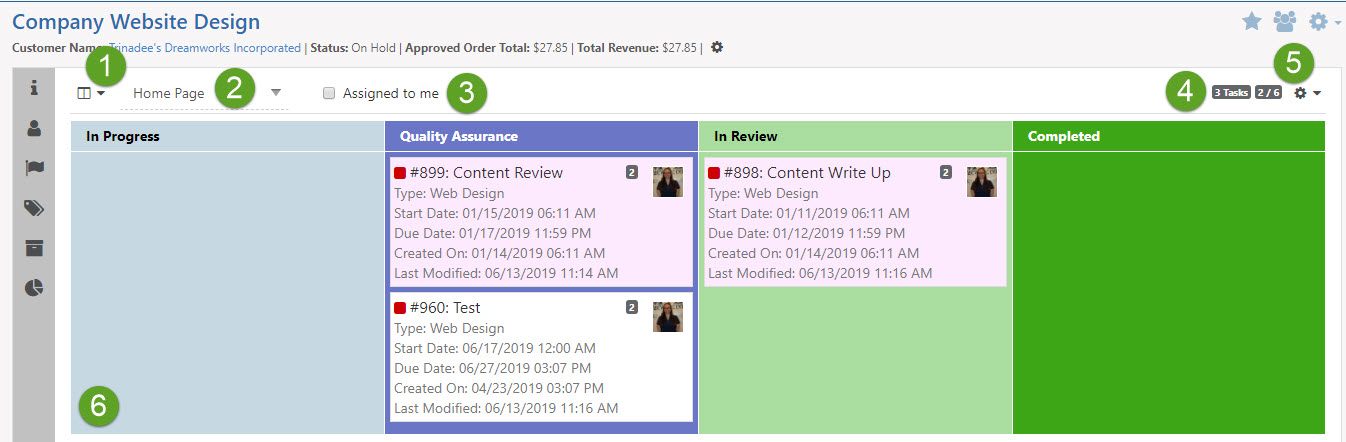
To move a Task between statuses, simply drag and drop the Task to the desired status. Project Managers can use this view to gain a more visual representation of how the Project is progressing. Below is a screenshot displaying how the Project Board appears and a list describing what you can configure there.
- Switch View: Users have the ability to switch their view of the Project. Views available include the Project Board and Milestones view, which are discussed in the section below.
- Milestone: Allows users to choose individual Milestones to view or they can choose to view all Tasks to show Tasks across Milestones.
- Assigned to Me: Users can utilize this checkbox to filter Tasks assigned to them.
- Tasks Info: Shows the number of Tasks and Budget hours for Tasks shown. Budgets will be represented by a fraction as shown below:
- The Budget indicates how many Budget hours have been completed (135) out of the total Budget hours (405) available.
- Configurations: The Gear icon allows users to configure the following listed below:
- Customize Board: This will initiate a popup to allow users to create Custom Status columns on the Project Board. Statuses can be added as an Open status or a Done status. Open statuses note that the Task is still being worked on. If a Task is dragged into a Done status column, the Task will be marked Done. Each Custom Status added can have its own color, if desired, to help create further clarity and distinction between statuses.
- Note: After typing the name of your Custom Status, press the Enter key on your keyboard to save it. Closing the Custom Statuses popup without pressing the Enter key will cause the changes to be lost.
- Task Display Settings: By utilizing the Task display settings, a popup will appear in which users will choose information like Created Date, Start Date, Due Date, etc. to show on each Task to display information without having to click into each individual Task.
- Customize Board: This will initiate a popup to allow users to create Custom Status columns on the Project Board. Statuses can be added as an Open status or a Done status. Open statuses note that the Task is still being worked on. If a Task is dragged into a Done status column, the Task will be marked Done. Each Custom Status added can have its own color, if desired, to help create further clarity and distinction between statuses.
- Task Statuses: Once custom statuses and columns are configured in the Project Board View, they will appear in the Task Kebab Menu to assign to Tasks in order to note the Task’s progress in the Project.
Example of Project Board
Below is a screenshot demonstrating how adding custom statuses to the Project Board will appear and how colors can be customized for each status as well.
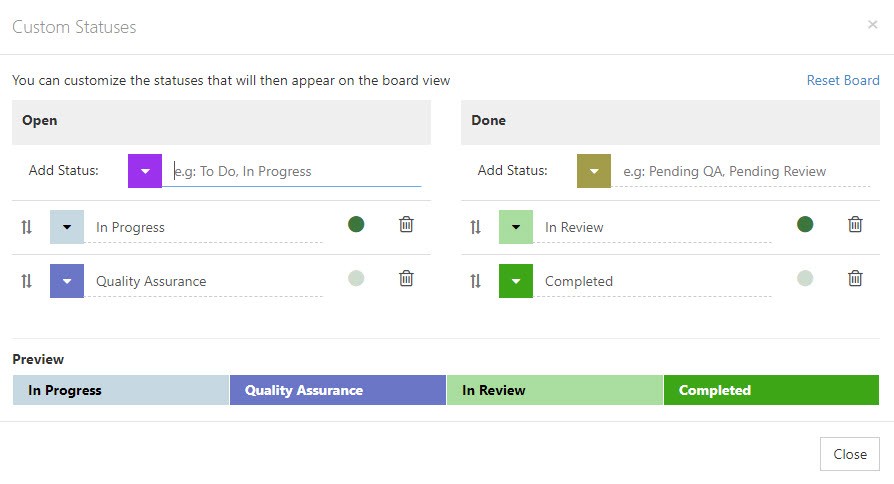
Example of Adding Custom Statuses & Columns
-
Milestone View
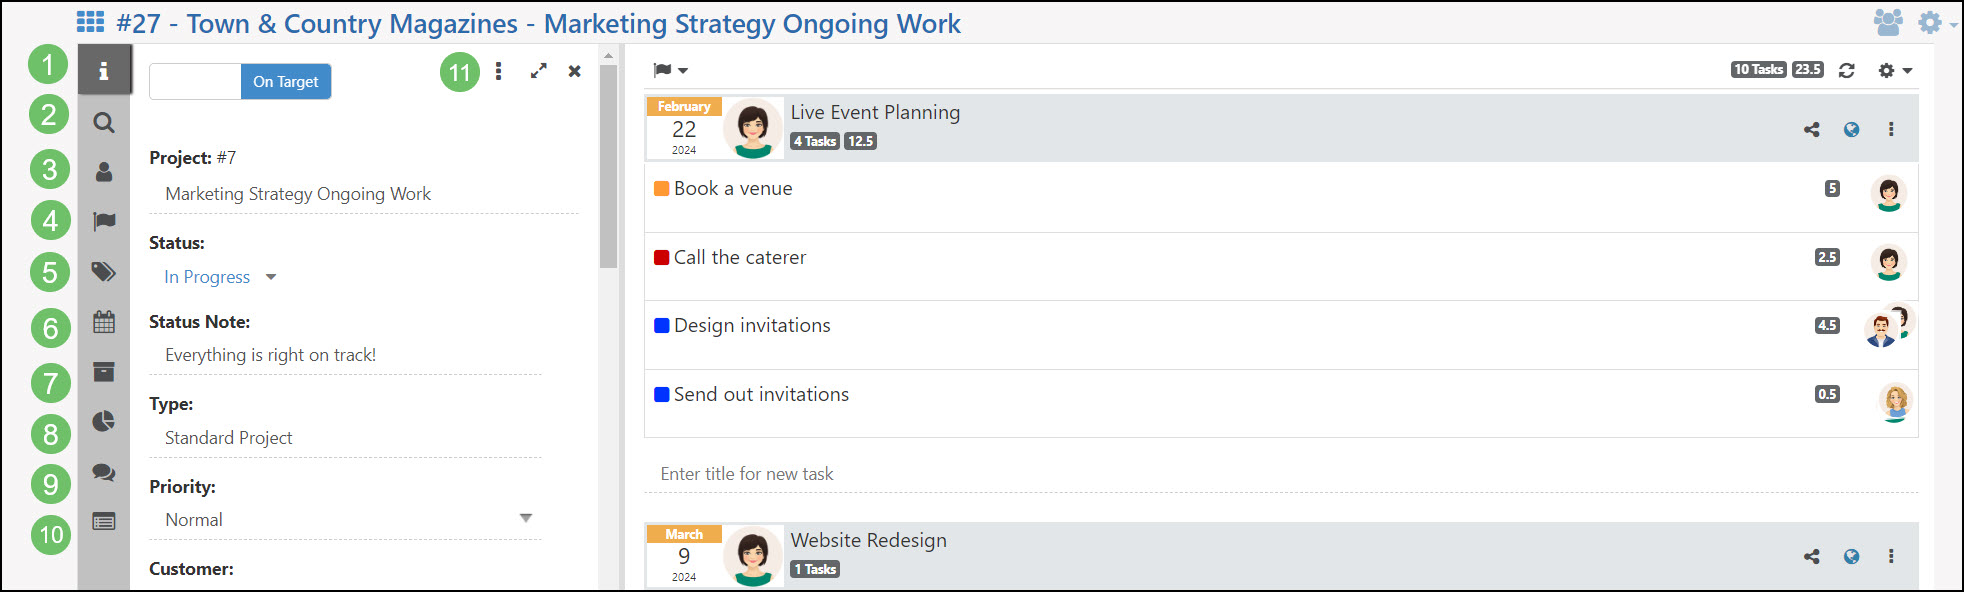
The Milestone view is the default Project View once a Project is created. We will continue talking about Project Management using this view as our reference. Much like the Project Board, all Project sections can be viewed by choosing the related icons on the Project Navigation Bar to the left of the screen. The Project Info section will appear on the left side when a Project is created, and the Task section will appear on the right side. Within the Project Info, there are several fields that you can use to configure the Project, including the Customer, Contact, Budget, and much more. As discussed earlier, there are several different sections within a Project, however, each has different functionality. Each section is described separately in the sections found below. Below is a screenshot displaying how the Project Info page appears in Milestone view and a list describing what you can accomplish there.
- Info: Contains information about the Project, including Customer, Contact, Project Manager, Department(s), Project Type, Start & End Date(s), Budget, etc. Orders can also be added or assigned to the Project in the Project info.
- Search: Allows you to search the project for a specific Task by Task Number, Task Title, and Type.
- Assignments: Shows who is assigned to the Project and their Assignment Category.
- Milestones: Displays the Project Milestones. Milestones will appear to the right, and Tasks can be entered underneath each Milestone.
- Labels: A collection of the added Labels in a Project. Labels can help to distinguish Tasks from each other and help organize Tasks in the Project.
- Due Dates: Provides the ability to update the Due Dates for Tasks within the Project. This can be accomplished by selecting a Due Date on the Calendar and then dragging and dropping Tasks to the desired Due Date. This feature also provides the option to filter the Tasks within the Project by Due Date.
- Hub: Allows access to folders, documents, links, and posts related to the Project and each can be made visible to the Customer as well.
- Surveying: Allows access to Assessments, Forms, Surveys, and Quizzes related to the Project.
- Discussions: Directs you to the Discussion Threads page related to the Project where you can view, add, or archive Discussions as needed.
- Orders: Displays a list of Orders related to the Project, with the options to Create an Order, Assign an Order, or view the existing Orders from the list.
- Actions: Allows users to initiate actions which are described below:
- Copy: Copies the Project and allows users to include the existing Milestones, Labels, Tasks, and more to the new Project as well if desired.
- Create Opportunity: Allows users to create an opportunity for the Customer associated with the Project.
- Mark as Reviewed: If the Project Type needs to be reviewed before being marked complete, this option will allow users to mark as reviewed.
- Copy Portal Link: If a Customer has been assigned to the Project, you may copy a link to the Project which the Customer may use to quickly access the Project within the Customer Portal.
- Audit Log: Initiates a popup to display changes made to the Project and all changes listed will be audited, including a name, date and time stamp.
- Notes: Allows users to enter Project notes to capture progress with the Project. Notes will be name, date, and time-stamped.
Example of Project Info
Relating Entities to Projects
Projects in Striven can be linked to Opportunities and other Projects.
To manually link an Opportunity or another Project to the Project click on the Linked To button in the side-menu of the Project and select the Add button to choose what entity you would like to manually link to the Project. Entities linked to the Project using this method will allow the user to remove the relationship by using the Delete icon.

Example of a Manually Related Entity to an Project
Below is a screenshot illustrating how the Project Linked To window appears and a description of what can be accomplished there.
- Add: Allows you to manually add an entity to be linked to the Project. Entities that can be manually linked to a Project include Opportunities and other Projects.
- Type: Lists the entity that is related to the Project with the current status underneath.
- Linked Entity: Lists the name and number if applicable for the linked entity. Underneath the linked entity will include additional information regarding the entity. Clicking on the hyperlink listed here will open the related entity to view more information.
- Delete: Allows you to remove a relationship between the entity and the Project. The Delete icon will only be listed for entities that were manually related to the Project through the Add button.

Example of the Information and Actions Available in the Project Linked To Window
Below is a screenshot illustrating how the Add option in the Project Linked To window appears and a description of what can be accomplished there.
- Relate To: A drop-down menu which lists the entities that can be related to the Project which includes Opportunities or other Projects.
- Entity: A search field that will search for the entity being related to the Project based on the name or number.
- Entity URL: An additional option to add a related entity is to add in the direct URL without having to use the search option.
- Show Inactive: Will adjust the results to include inactive results to be selectable. By default, only entities in an Active status will be listed.
- Results: Lists the search results based on either the Entity search or the Entity URL search options from above. Results listed can be multi-selected to include as linked to the Project before using the Save button.

Example of the Actions and Information Available in the Add Option for the Project Linked To Window
-
Gantt Chart
To use the Gantt Chart View within Projects you must have an open Milestone with a due date and Tasks under that Milestone.
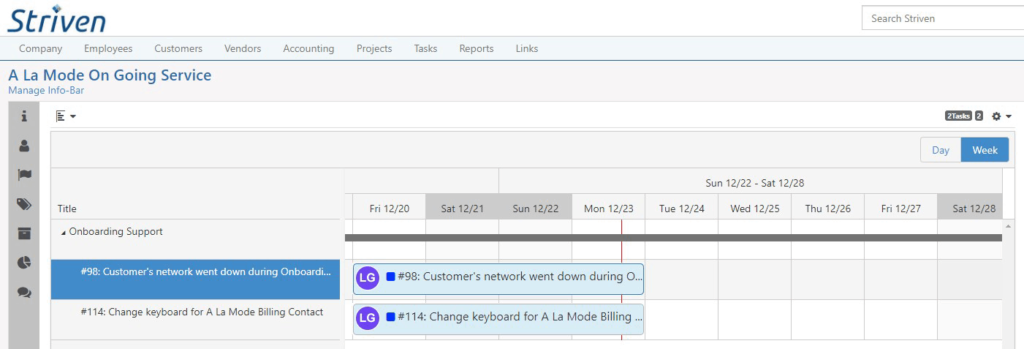
Example of Gantt Chart View
You can drag and drop the due dates of Tasks and Milestones within the Gantt Chart View to change individual Milestone or Task due dates on the same screen.
- Note: The drag/drop feature is not available in the Month view of the Gantt Chart, only the Day and Week views.
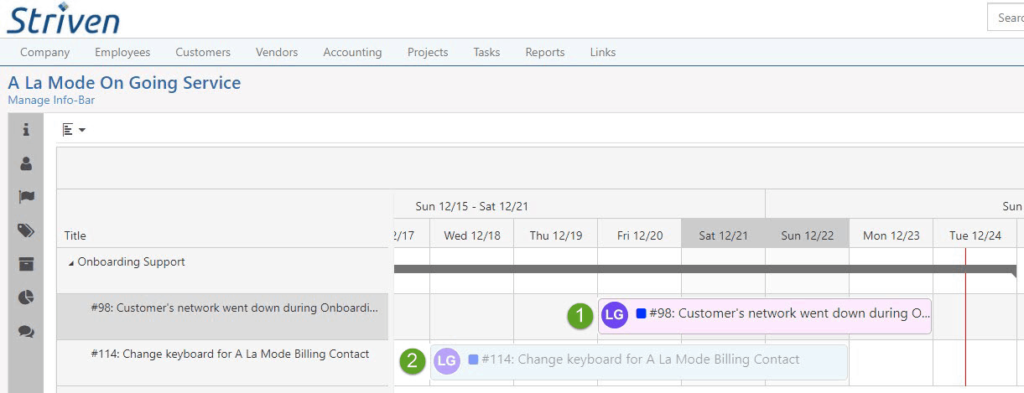
Example of Tasks Displayed in the Gantt Chart View
- Overdue Tasks are shown in pink.
- If you have selected the settings option to show Tasks marked Done, they will show with a faded look to them .
- Note: The drag/drop feature is not available in the Month view of the Gantt Chart, only the Day and Week views.
-
Project Task Search
You can search for a specific Task within a Project using the Task Search feature located in the Project Navigation Bar on the left side of the page. The Tasks Search option is available on all Project views.
To search for a Task, click the Magnifying Glass icon to open the Task Search pane.
The Task Search pane contains the following Search fields and options:
- Task Number: Allows you to search for a Task by the Task’s exact number.
Note: Searching by Task number will ignore all other search criteria. - Task Title: This field allows you to search for a word or phrase present in the title of a Task. This search field can be used in combination with the Task Type search.
- Type: This dropdown menu allows you to search for Tasks by their Task Type. You may only search for one Task Type at a time.
- Search: Clicking the blue Search button will allow you to run the Search based on your chosen filters.
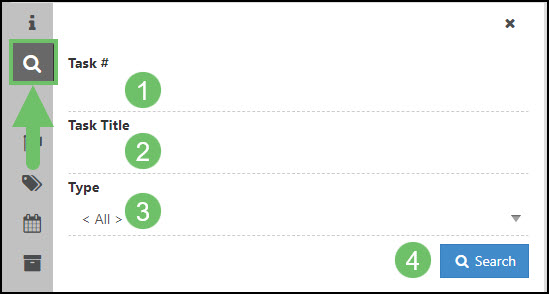
Example of the Tasks Search Pane within a Project
The Tasks Search feature can be used in conjunction with other Project Filtering options such as labels. If the Tasks within the Project have been filtered by label, the Search Filter will search through the Tasks which have the applied label exclusively for Tasks which match the Search criteria.
After a Search has been completed, clicking the blue Clear Filters option located next to the Project’s Switch View option will remove all filters, including Task Search filters, label filters, and Milestone filters.
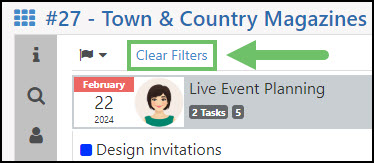
Example of the Clear Filters Button Available within a Project
- Task Number: Allows you to search for a Task by the Task’s exact number.
-
Project Assignments
Project Assignments can be added to a Project to assign Tasks and collaborate with other Employees to complete Tasks within the Project. Assignments can also be made visible on the Portal, which will allow the Customer Contact to see who’s working on the related Project. There can only be one Primary Assignment to a Project, and this is set while editing or adding an Assignment in the Project. Below is a screenshot illustrating how the Project Assignments section appears and a list describing what you can accomplish there.
- Add Assignment: Allows users to add a new Assignment and configure many options, including whether it is a Primary Assignment if it’s visible on the Portal, and much more.
- Edit: Allows users to edit the Assignment, including the Assignment Category, the Employee assigned, whether the Assignment is Primary, and if it is visible on the Portal.
- Delete: Deletes the Assignment from the Project.
- Portal Visibility: The Globe icon here will allow users to mark Assignments as visible to Contacts on the Customer/Vendor Portal. When the Globe icon is blue, this indicates that the entity is set as visible on the Portal. Gray will indicate it is currently not visible on the Portal.
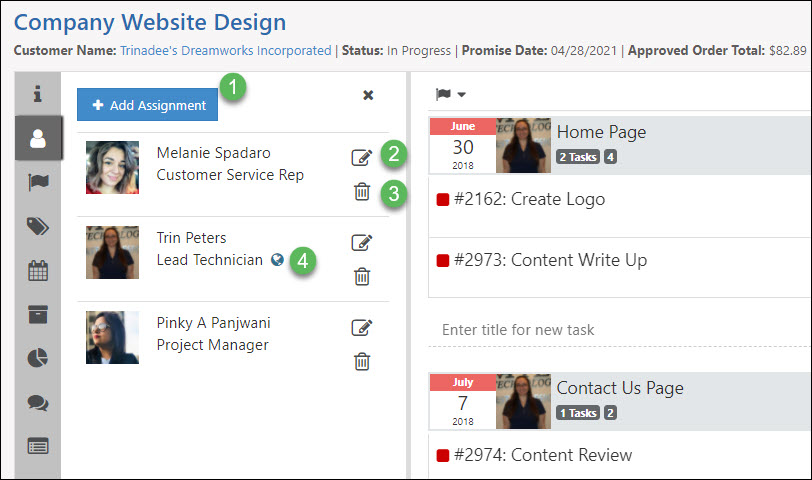
Example of Project Assignments Options
To designate or change a Task Assignment, simply drag and drop the Task onto the Assignment you wish to set for that Task. The Assignment’s image will then appear on the Task as displayed in the example below.
Example of Dragging a Task to Designate Assignment
-
Project Milestones
Adding a Project Milestone enables the Project Manager to keep track of the individual Tasks that make up each Milestone to ensure the Milestone stays on course. If Tasks under a Milestone each have a Budget, then the Milestone will display the total Budget as well. Dates visible on the Project screen are the Milestone End Dates in order to track how close the Milestone is to the scheduled End Date. If the Milestone is past its End Date, it will appear in red while Milestones on schedule will have an orange End Date.
-
Creating Milestones
When adding a new Milestone, users can Name the Milestone, select the Start and End Dates, designate the person responsible for the Milestone, enter Milestone notes, and choose if the Milestone should be visible in the Portal. If a Milestone is not marked as visible, the Tasks under the Milestone will also not be visible to Portal users. Below is a screenshot illustrating how adding a Milestone appears.
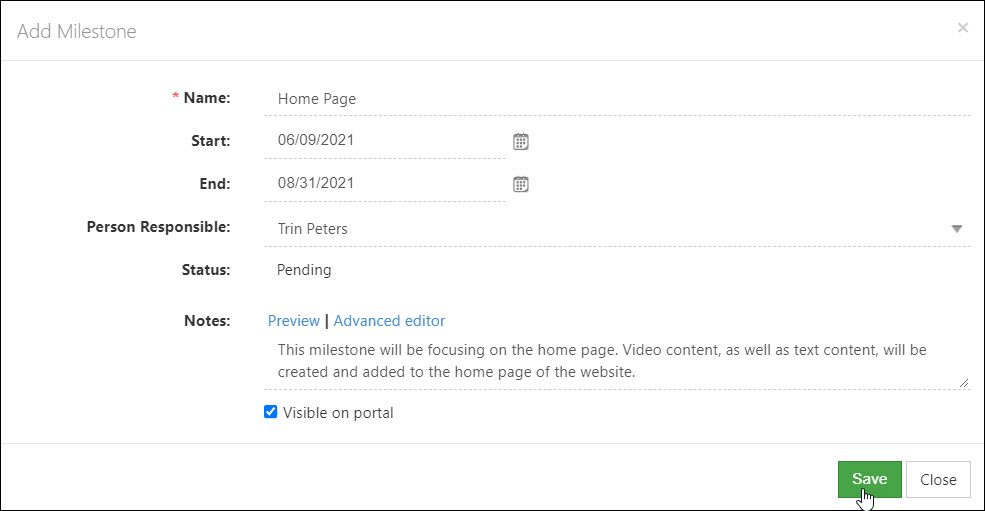
Example of Adding Milestones
-
Copy Milestone
The Copy Milestone feature serves as a powerful utility for streamlining project management. Instead of manually recreating complex Milestones, you can seamlessly replicate existing ones either within the current Project or across entirely different Projects within the system. This functionality offers granular control, allowing you to specify exactly which components, such as Task Assignments, Task Statuses, and other details, should be carried over. By automating the reproduction of established Milestone structures, this tool significantly reduces administrative overhead and minimizes the risk of inconsistency, making it an essential asset for teams aiming to maintain efficiency and standardize Project execution.
To use the Copy Milestone feature, click on the vertical ellipsis icon located in the right top corner of a Milestone.
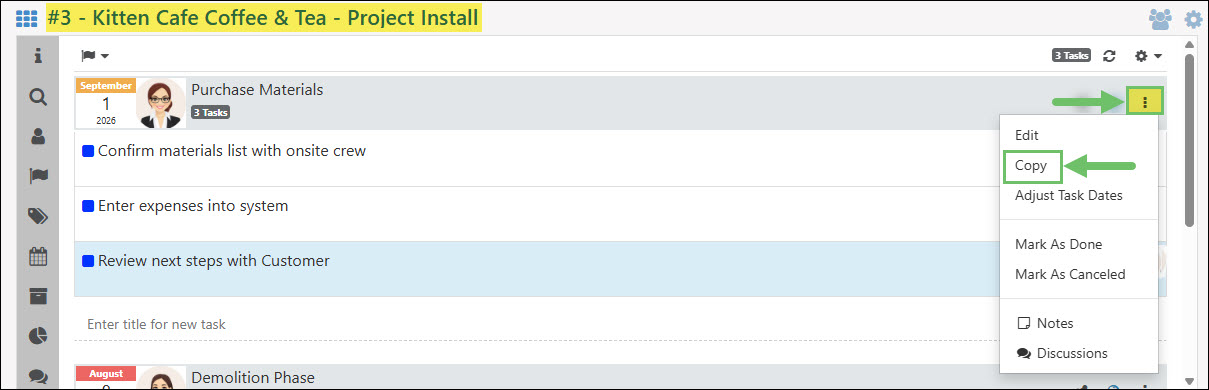
Example of the Location of the Copy Milestone Option
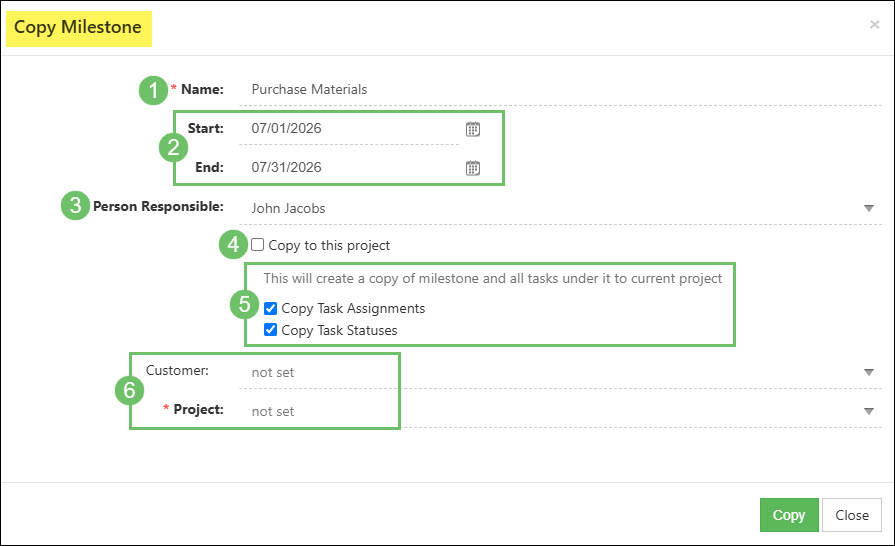
Once you click on the Copy option in the Milestone, the Copy Milestone popup will appear with configuration options on what should be copied over for the new Milestone being created. Below is a screenshot illustrating how the Copy Milestone popup appears and a description of what can be accomplished there.
- Name: The name of the Milestone will be prefilled based on what the name of the original Milestone was set to. This field can be overridden to create a new name or the existing one can be used.
- Start/End Date: Determines in the new Milestone that is being created when the Start and End Date should be set to. These dates will be prefilled based on what the Start and End Dates were in the original Milestone but can be overridden as needed.
- Person Responsible: Lists the Employee who will be responsible for the new Milestone being created. This field can be changed before the Milestone is created if a different Employee should be responsible for managing the Project Milestone.
- Copy to this project: This option will be toggled on by default but can be unchecked in order to choose a different Project to create the new Milestone in. Once this option has been toggled off, the Customer and Project fields at the bottom of the Copy Milestone popup will appear in order to select this information.
- Copy Task Assignments/Statuses: Optional configurations to determine if the Task Assignments and Task Statuses should be copied over when the Milestone Tasks are created in the new Milestone.
- Customer/Project: The Customer and Project fields will only appear if the Copy to this project is toggled off. While the Customer field is optional, you must select a Project in the Project field in order for the new copied Milestone to be created.
Example of the Copy Milestone Popup
-
Managing Milestones
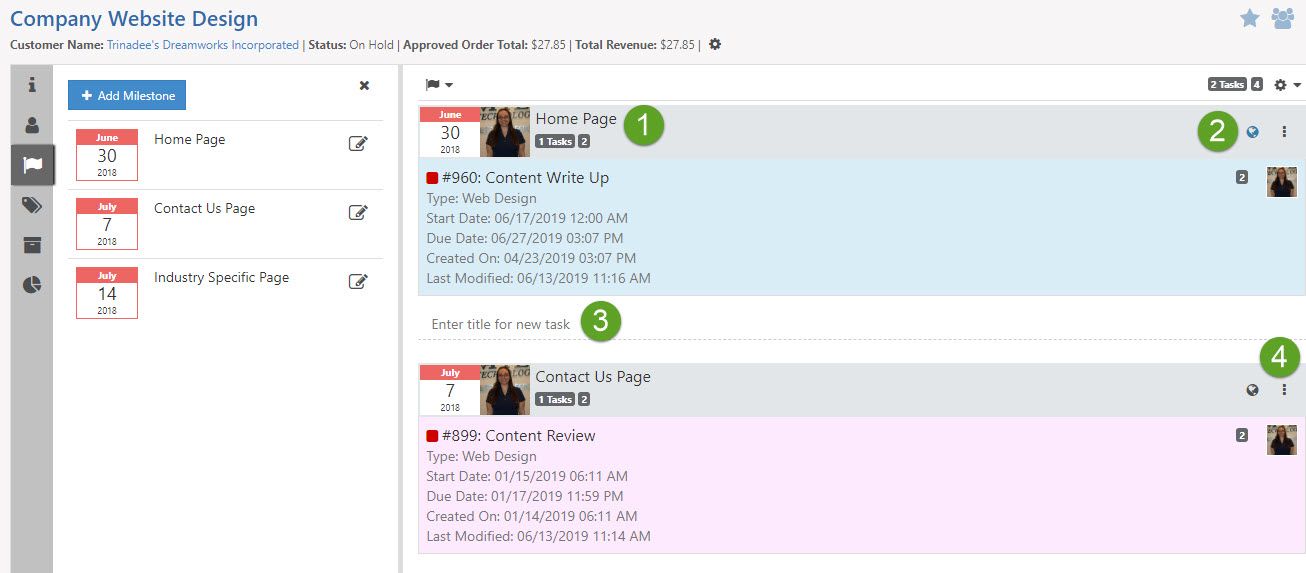
Once Milestones are created, Tasks can be associated with them which will list them underneath the appropriate Milestone. Each Milestone shows who is responsible and the date on which the Milestone is due. From the menu, the Milestone can also be marked as Done or as Cancelled. Discussions can also be sent from this menu to either the Contact or an Assignee. Discussions started by Contacts in the Portal that are related to a Project will go to the Primary Project Assignment if a recipient is not selected. Below is a screenshot representing how Milestones appear in a Project with Tasks associated with them and a list describing what you can accomplish there.
- Milestone Info: Displays the name of the Milestone, the Milestone’s End Date, who is responsible for the Milestone, and the Milestone Budget.
- Visible: Allows users to mark Labels visible to Contacts on the Customer/Vendor Portal. The blue globe indicates visibility on the Portal, while gray indicates it is not visible. If a Milestone is not marked as visible, then Tasks in the Milestone will not be visible in the Project section in the Portal either.
- Enter New Task: Allows users to enter a name for the Task being created under the Milestone. By clicking enter, the Task will be created and users can configure the Task as needed.
- Actions: Additional actions are available within the Project which are detailed below:
- Edit: Initiates a popup for users to edit the Milestone information.
- Copy: Allows users to copy the Milestone in the same Project.
- Mark as Done: Marks the Milestone as Done. If Tasks associated with the Milestone are not marked Done, then a warning will appear asking the user if they would also like to mark the Tasks for this Milestone as Done with the Milestone.
- Mark As Canceled: Cancels the Milestone and warns users that open Tasks within the Milestone will also be marked as Canceled.
- Notes: Allows users to enter Milestone notes to capture progress within the Milestone. Notes will contain the name, date, and time stamp.
- Discussions: Opens a new browser tab in which users can view and create Discussions from the Milestone.
Examples of Milestones in a Project
-
Milestones List
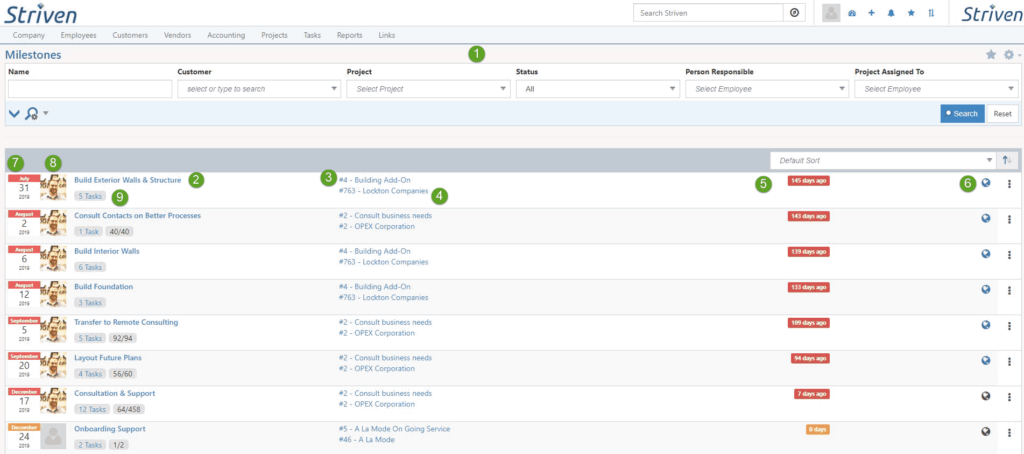
Here you can search through all Milestones regardless of which Project they are under. You can use the filters to narrow down your search. The name of the Milestone is hyperlinked and you’ll be able to jump right into the specific Milestone within the Project by clicking the hyperlink.
Projects → Milestones
- Search: Includes filters for narrowing down Milestones to display in list.
- Milestone Name: Displays the Name of the Milestone as a hyperlink to the Milestone Info page.
- Project Name and Number: Displays the Project Name and the Project Number as hyperlinks to the Project.
- Customer Name/Number: Shows the Customer’s Name and Number as hyperlink to that particular Customer.
- Milestone Due Date: Displays whether the Milestone Due Date is past due or set for a future date.
- Portal Visibility: The Globe icon indicates whether the Milestone is visible in the Portal; blue is visible, gray is not.
- Milestone Due Date Calendar Icon: Icon displaying the Milestone’s Due Date.
- Person Responsible for Milestone: Image indicating the person designated as responsible for the Milestone.
- Number of Tasks: Indicates the number of open Tasks and Tasks completed in the Milestone.
Example of a Milestone List
-
Project Labels
Adding a Project Label helps organize a Project apart from the Milestones by separating individual Tasks by their Labels. Labels can dictate anything the Project Manager would like in order to organize the Tasks accordingly. The colors of each Label can also be customized to create more individuality. When Labels become less relevant or useful, they can be archived within a Project with the option to unarchive them if needed in the future. Below is a screenshot featuring how Project Labels appear and a list describing what you can accomplish there.
- Show Archived: Shows all Labels that have been archived for users to unarchive the Label.
- Visible: The Globe icon here will allow users to mark Labels visible to Contacts on the Customer/Vendor Portal. When the globe is displaying blue, visibility to the Portal is turned on; a gray globe indicates no visibility in the Portal.
- Options: Additional actions are available which are detailed below:
- Except This Label: Filters the Tasks within the Project to exclude any with the selected Label.
- Edit: Allows users to edit the Label name and color.
- Delete: Deletes the Label from the Project and will not be available once it’s deleted.
- Archive: Archives the Label and hides it from the Project. Archived Labels can be unarchived.
- New Label: Users can add a new Label by typing a name and clicking enter. The Label color can be changed before creation by clicking on the color square and choosing a new color from the drop-down.
- Added Labels: To assign a Label, simply drag and drop the Task onto the Label. The Label will then appear on the Task as displayed in the example provided.
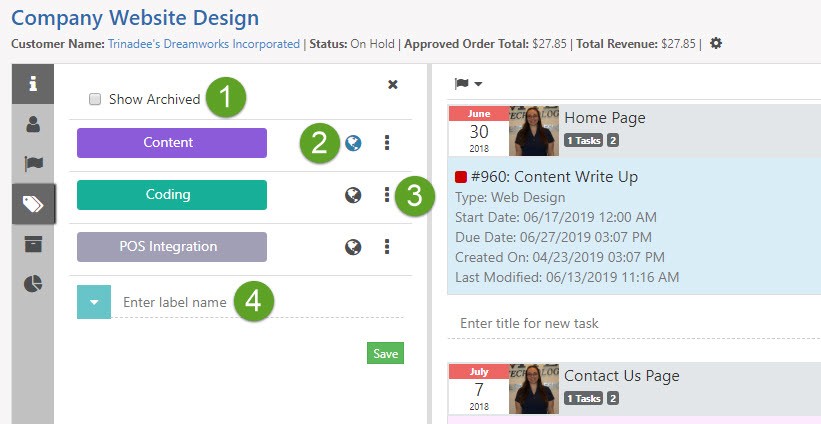
Example of Project Labels
-
Applying Project Labels
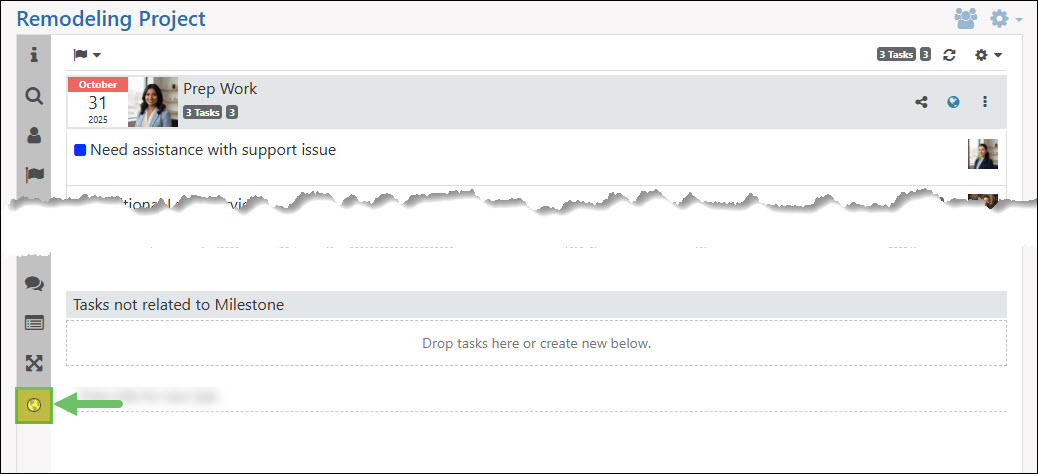
Project Labels can be applied to Tasks within the Project in similar ways to how Task Labels can; by dragging/dropping the Task to the Label in the Project Label List, or from the Task kebab menu by clicking Add Label.
The difference here is that you can only apply Task Labels to Tasks within a Project through the Task kebab menu, as the Task Label List does not display on the Project page. When applying Labels to a Task within a Project from the Task kebab menu , you will see the popup has both Task Labels and Project Labels to choose from.
- Note: If a Task is not related to a Project, you will not have the option to apply any Project Labels to the Task.
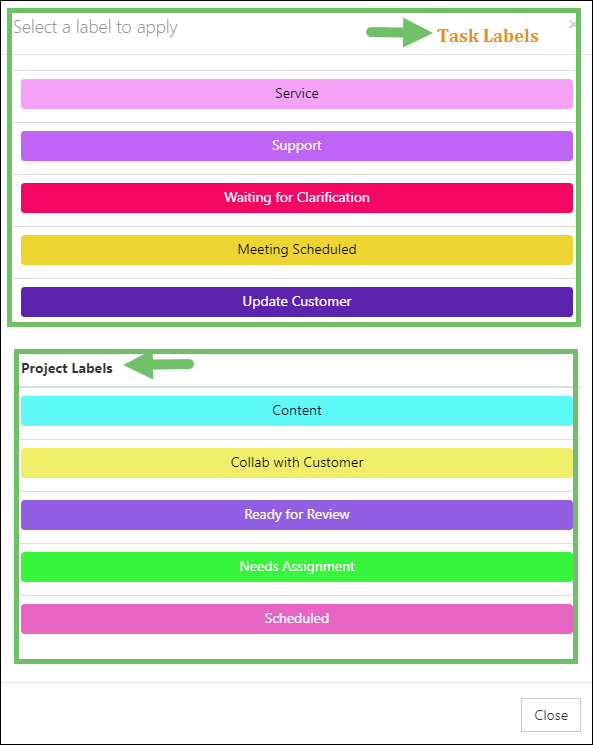
Example of Add Label Popup from Task Kebab Menu of Task Within a Project
-
Using Project Labels to Filter Tasks
In addition to the visual identification assistance Project Labels provide, you can also use them to filter Tasks in your Project. To filter your Tasks within a Project based on Project Labels, click on a Project Label from the list on the Project Navigation Bar. This will display only the Tasks that have that Project Label applied to them. You can select multiple Project Labels to filter by in order to narrow down your results. If you wish to remove Project Label filters, there will be a Clear Filters option on the top of the Project View area, whether in Milestone View, Project Board View, or Gantt Chart View.
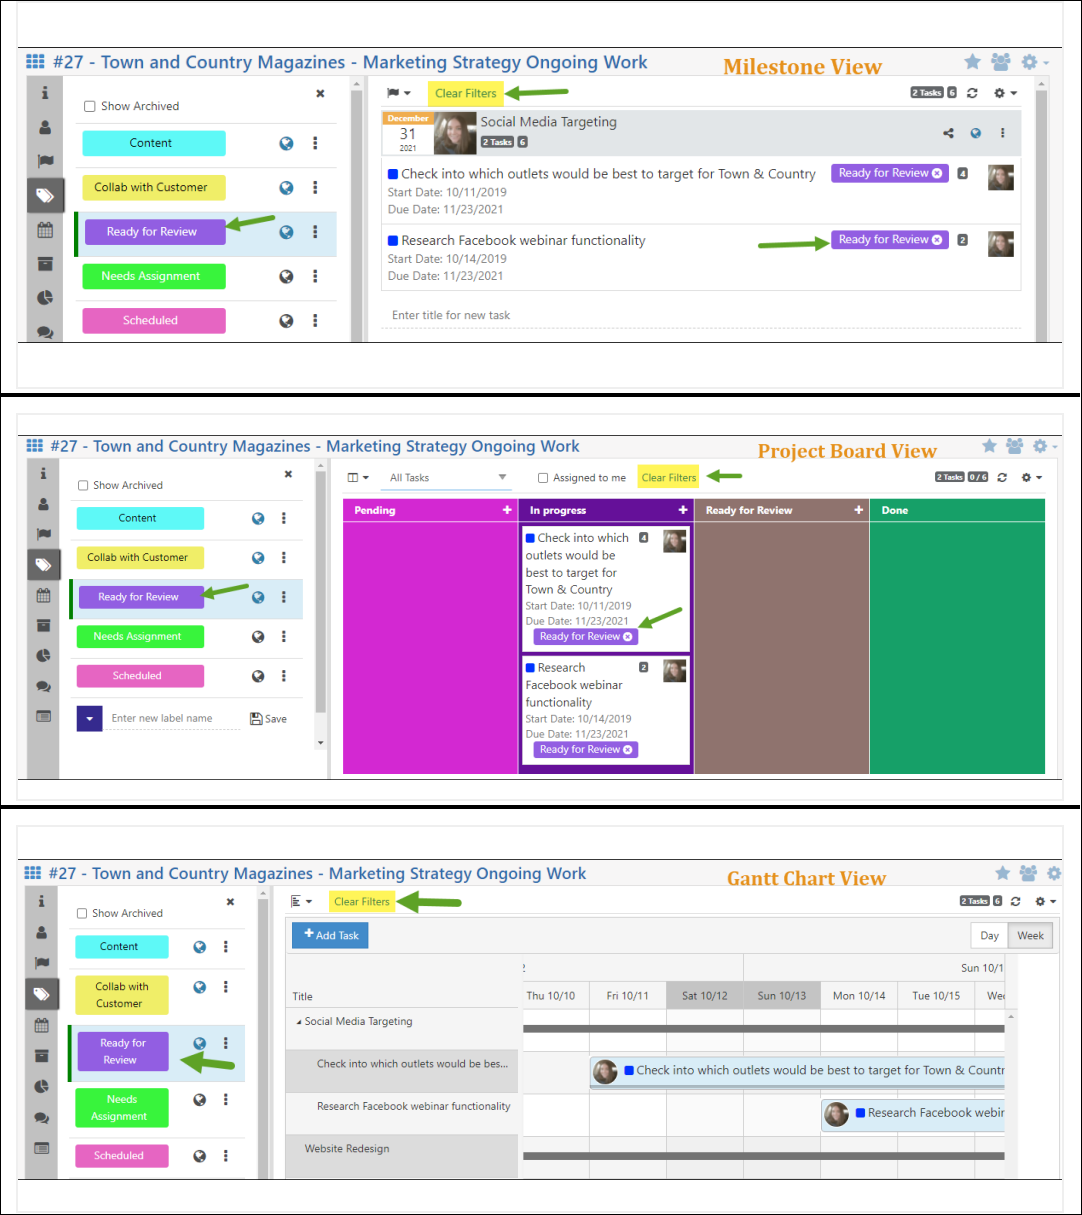
Example of Project Label Filters on Milestone View, Project Board View, & Gantt Chart View
-
Project Hub
The Project Hub is a digital filing cabinet of sorts and can store all your documentation, such as documents, links, posts, and folders related to the Project. With Hub, you can have documents and folders in Content Groups, which will help differentiate and organize folder content. You can also add sections to your Hub which can store their own content groups. Sections can act like Departments in your company to help separate content in a clear and concise way. Uploading content is easy with two Plus icons; one for folders and another for content. Once setup is complete, content can be added on an ongoing basis. Employees can easily find documents and links that are uploaded in Hub and can use the Search Content feature to find content in each section of the navigator which also finds Hub content. Below is a screenshot showing how the Project Hub is displayed. For more information on Hub’s functionality, you can visit the Hub Support Guide.
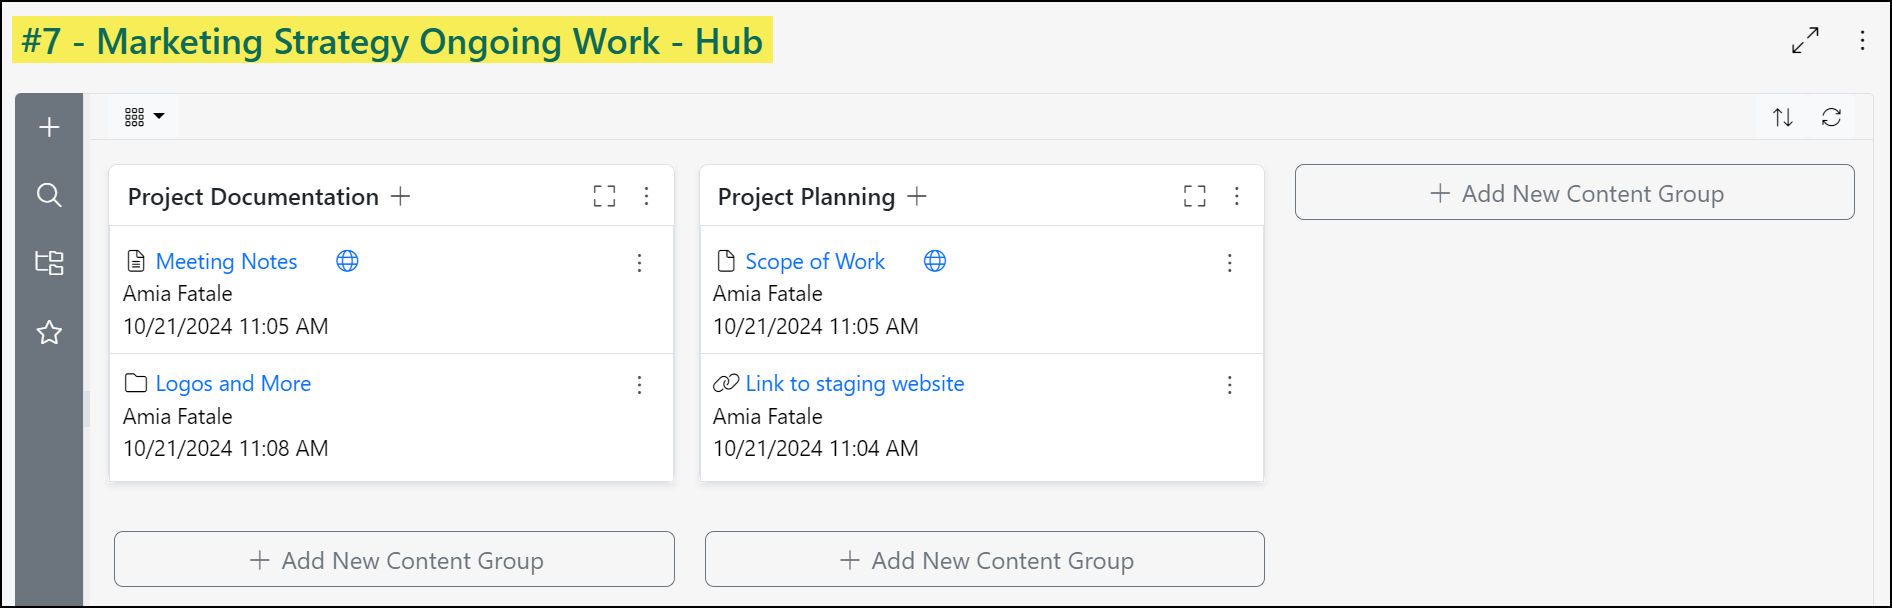
Example of the Project Hub within Striven
Reporting
-
Project Profitability Report
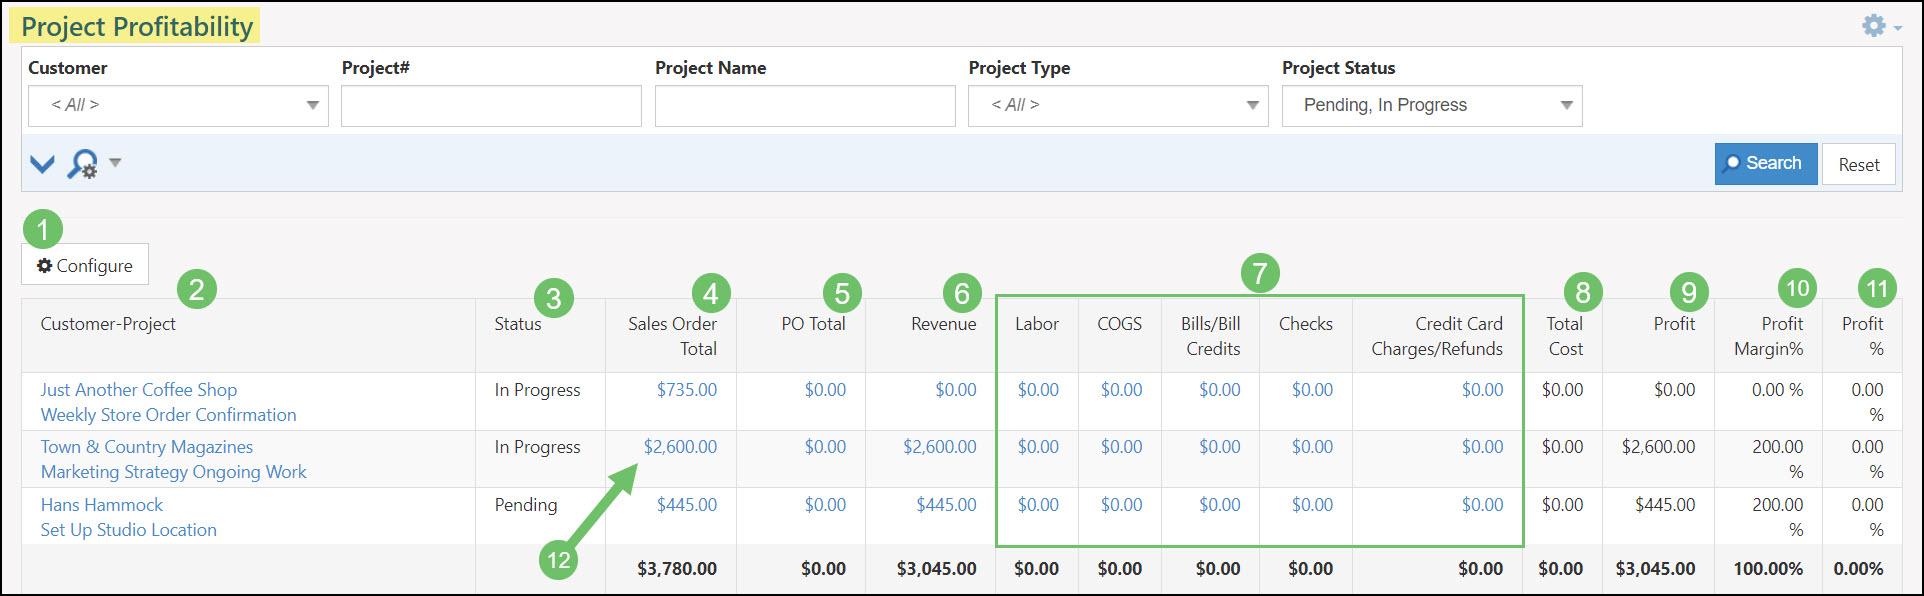
The Project Profitability Report shows how much profit your projects are estimated to make and how much each project will cost to complete. To populate data into this report, orders need to either be assigned or added to the Project Info screen (See Creating a Project Above), and you will need to configure which expense columns you would like to calculate Total Cost. By default, Cost Of Good Sold and Labor are added to the report. Below is a screenshot exhibiting how the Project Profitability Report appears with all possible columns added and a list describing what you can accomplish there.
To view the Project Profitability Report, navigate to:
Reports → Projects → Profitability.
- Configure: Allows you to configure which Expense columns you would like to include in the Total Cost calculations.
- Customer-Project: Displays the name of the Customer and the Project.
- Status: Shows each Project’s status which includes Pending, In Progress, Done, Canceled, and Reviewed.
- Order Total: Shows the sum of the Sales Orders associated with the Project.
- PO Total: Shows the sum of Purchase Orders associated with the Sales Order and Project.
- Revenue: Shows how much has been invoiced from the Sales Orders.
- Labor: Shows how many labor hours are associated with the Project. This total is pulled from timesheets submitted by users. When configuring your Report, you can choose which Timesheet items to include in this total.
- Expense Columns: The columns displayed in this section calculate your total cost. You can choose to display Labor, Cost of Goods Sold, Bills/Bill Credits, Checks, and Credit Card Charges/Refunds as columns.
- Total Cost: Totals up the configured Project Expense columns to illustrate the total costs associated with the Project.
- Profit: Totals up the Project’s revenue and the total cost to illustrate how much profit the Project stands to make.
- Profit Margin %: Shows the profit margin of the Project as a percentage.
- Profit %: Shows the profit of the Project as a percentage.
- Hyperlinked Column Totals: The Sales Order Total, PO Total, Revenue, and Expense column amounts are linked to view details of the transactions that make up this total. Clicking on one of these column totals will trigger a new browser tab to display with a list of the transactions that make up that total amount from the report. To dig even further you can click on the names of the listed transactions to view them individually.
Example of Project Profitability Report
-
Burndown Report
The Project Burndown Report helps forecast how long it will take to complete the related Project based on the Project End Date and the Project Budgets. Project Budgets consist of all individual Task Budgets in the Project to indicate how many hours have been budgeted to complete the Project. The Burndown Report can be accessed from the Projects List by clicking on the hamburger menu to the left of the Project name and number as shown in the image below.
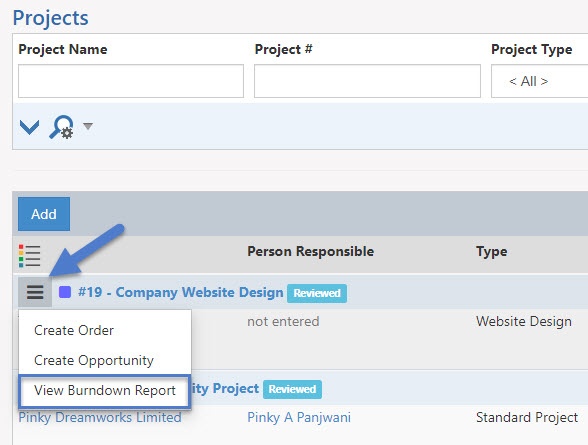
Example of Location of Burndown Report
When viewing the Burndown Report, users can choose what values they would like to use to estimate a completion date for the Project. By entering a value in the End Date field, the report will estimate how many hours will need to be worked per day to complete the Project on that date. By entering a value in the burn rate field, the report will estimate the End Date based on the hours worked in a day. Below is a screenshot displaying how the Burndown Report appears.
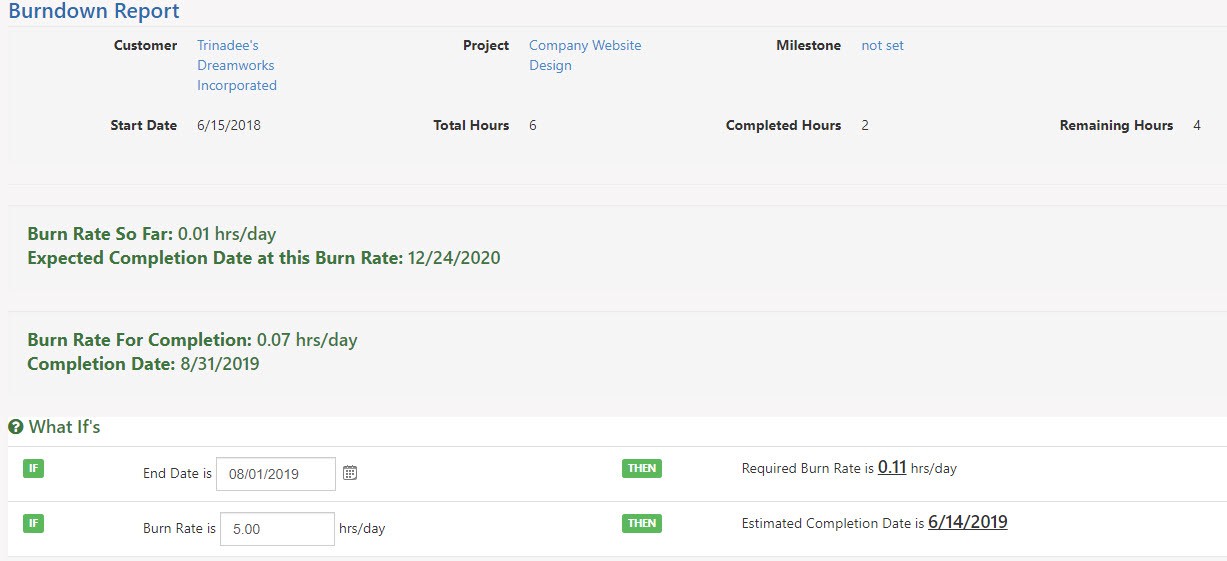
Example of Burndown Report
-
Milestone Status Report
The Milestone Status Report shows the target of each Milestone and the Project that the Milestone is underneath. This report will allow users to better manage the Milestones for Projects to better manage completion rates. Below is a screenshot illustrating how the Milestone Status Report appears and a list describing what you can accomplish there.
To view the Milestone Status Report, use the following steps:
Reports → Milestone Status
- Milestone: Shows the name of the Milestone and each Milestone name is a hyperlink, which when clicked will bring users into the Project to view the Milestones and Tasks.
- Customer: Shows the Customer the Project is assigned to. The Customer name is a hyperlink, which will populate the Customer Dashboard for users to view the Customer’s information.
- Project: Shows the name of the Project and each Project name is a hyperlink, which when clicked will bring users into the Project.
- Person Responsible: Shows the name of the person responsible and each name is a hyperlink, which when clicked will allow users to view the Employee’s information.
- Start Date: Shows when the Milestone starts.
- End Date: Shows when the Milestone ends.
- Completion Date: Shows when the Project was marked as Completed.
- +/- Target: Shows how on target the Milestone is based on the current date to the End Date of the Milestone. If Milestones are past due, the number will appear in red here. If the Milestone has not reached its End Date, then the number will appear in black.
- Status: Shows the status of each Milestone. Statuses include Pending, Canceled, and Done.

Example of Milestone Status Report
-
Project Management Dashboard
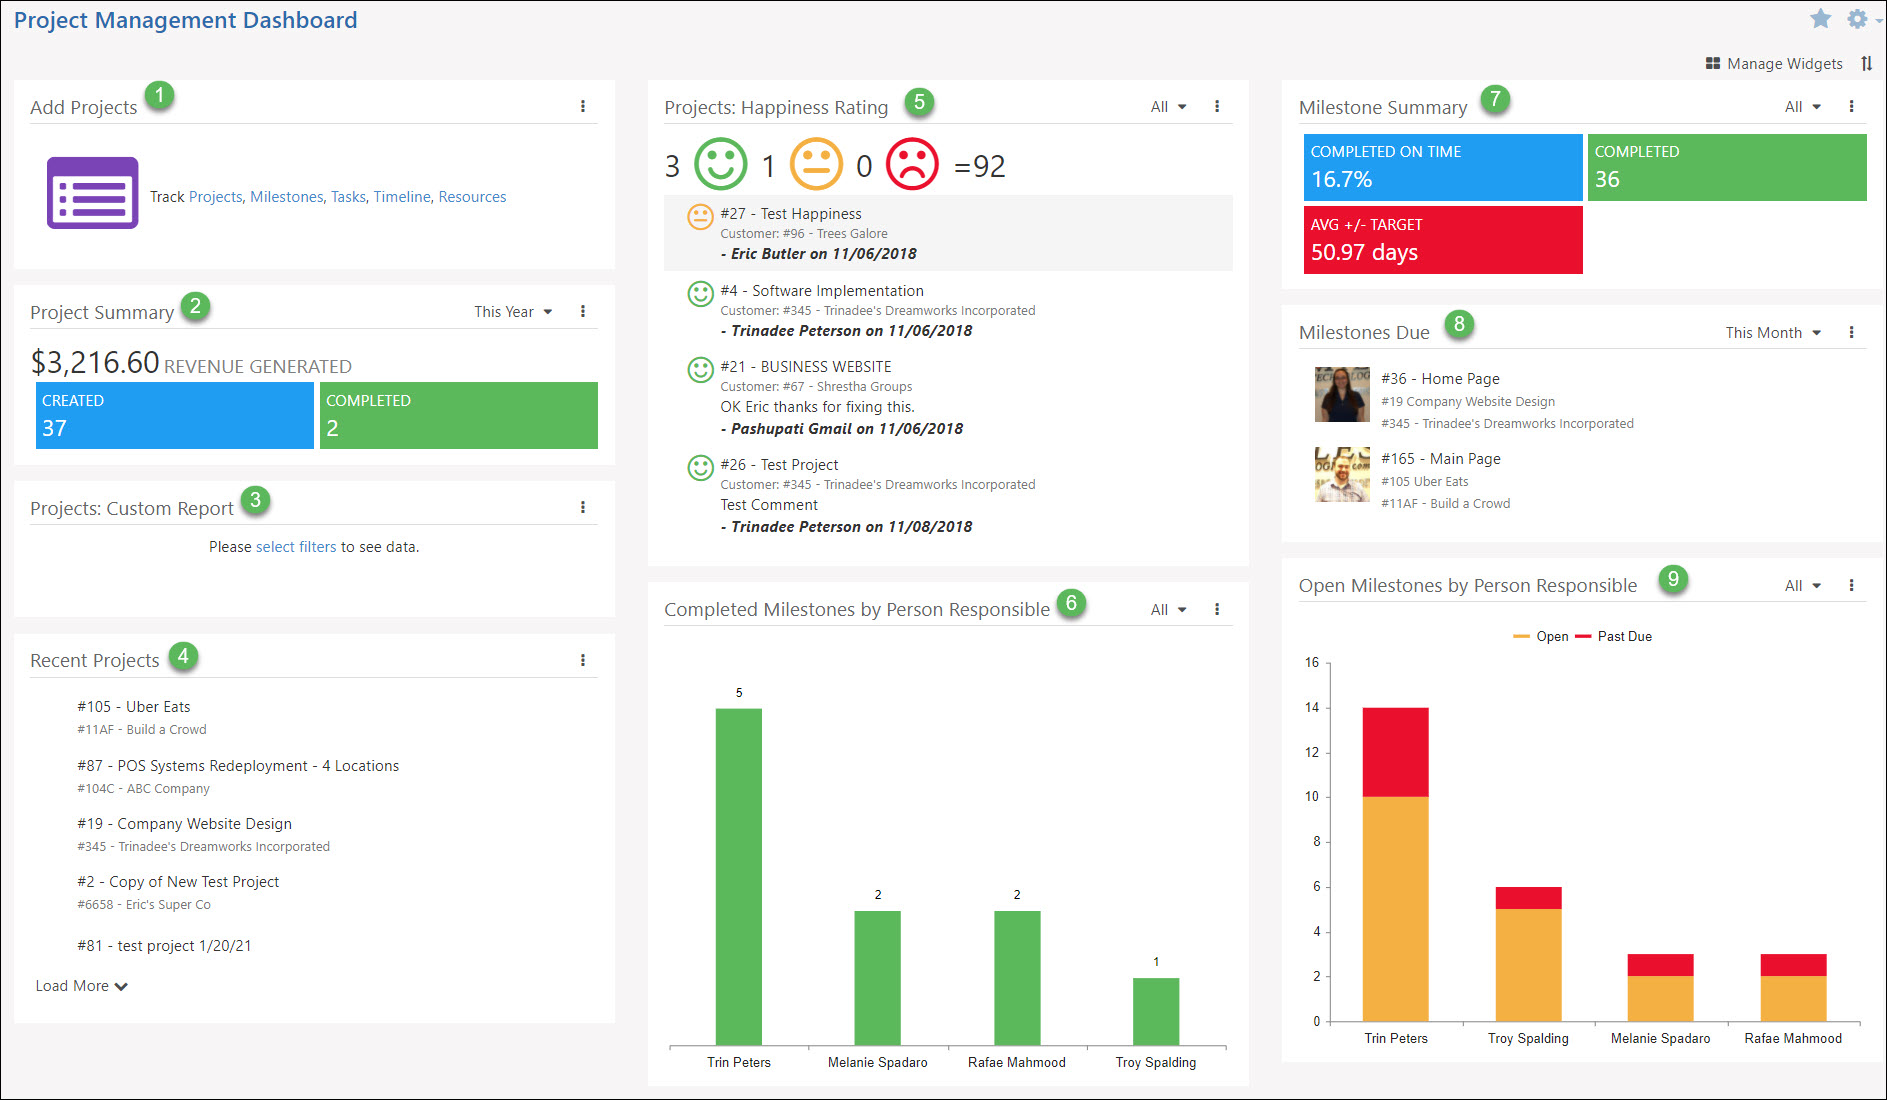
The Project Management Dashboard provides a convenient way to view information regarding your Items, Accounts Payable, and Accounts Receivable transactions all in one place. Widgets can be added, removed, and restructured using the Manage Widgets popup on the right-hand side of the Dashboard page. Below are some of the available widgets in the Accounting Dashboard page.
Projects → Dashboard
- Note: Any widgets available on the Project Management Dashboard page will also be available on the My Dashboard page. Also, all widgets can be renamed.
- Add Projects: Use this widget for quick links to the Projects List, Milestones List, and Tasks List.
- Project Summary: Use this widget to view revenue generated and the number of Projects created and completed within a given time frame.
- Projects: Custom Report: Use this widget to show results from custom reports created using the Report Builder and using the Projects dataset.
- Recent Projects: Use this widget to show the most-recently-viewed Projects. These Projects can also be “pinned” using the Pin icon to the left of the Project to keep them on this list regardless of the last time you viewed them.
- Projects: Happiness Rating: Use this widget to view a filtered or unfiltered view of happiness ratings provided by your Customer Contacts for Projects.
- Completed Milestones by Person Responsible: Use this widget to view a filtered or unfiltered view of how many Milestones were completed and who was the person responsible in a bar graph view.
- Milestone Summary: Use this widget to view the percentage of Milestones completed on time, the total of Milestones completed, and the average days before or after the target date the Milestones were completed within a given time frame.
- Milestones Due: Use this widget for a filtered or unfiltered list of Milestones due within a given time frame. You can select each Milestone to drill into the Project.
- Open Milestones by Person Responsible: Use this widget to view open and past due Milestones for a particular Employee, Department, or Team in a bar graph view.
Example of Project Management Dashboard
-
Recap
With this guide, we’ve discovered how to utilize Projects within Striven by setting up your Project Types, Assignments, Milestones, and Labels Reporting on Project information was also covered to enable your team to track Project profitability and Milestone statuses.
Have a Question?
Ask the Striven Community
User-sourced how-to’s, feedback, and more!
FAQs
-
Is it possible to create a Project template?
Creating a Project Template is possible within Striven. To do this, create a Project and add all of the Labels, Assignments, Milestones, and Tasks you’d want to your template. Then, create a copy of the Project, copying everything. Anytime you want to create a Project like this one, simply copy this Project again.
-
I keep trying to mark my Project done, but I’m not able to. What can I do to mark it done?
There are some things to check before marking a Project as Done. Ensure all Tasks have been marked Done. If a Task isn’t marked Done, ensure the Tasks are actually complete and mark them as Done. If all Tasks are marked Done, ensure all Milestones are also marked as Done. If there are open Milestones, click on the kebab menu (as shown above under Project Milestones) to mark them as Done.