
Productivity Tools
Report Builder
Support Guide
-
Overview
Utilizing the Report Builder in Striven allows your Company to create and run detailed reports to monitor and share important information from your Striven system. You can share these reports within Striven, or export them as well.
Read this guide if you are trying to:
✔ Configure reports to monitor data within Striven.
✔ Use filters, grouping, and aggregation to show the information you want to find.
✔ Export and use API Keys to send your reports to a spreadsheet or another destination.
-
Using Report Builder
Users can build their own reports using Report Builder tool inside of Striven. The Report Builder offers the previous ability to create Custom Reports using Datasets. Available datasets include Tasks, transactions, Customers, and more. Each dataset has its own set of filters, columns, and relationships. Filters and columns can include Custom Field data as well to help provide as many helpful options as possible. To find the Report Builder, you can use the steps in the image below:
Reports → Report Builder
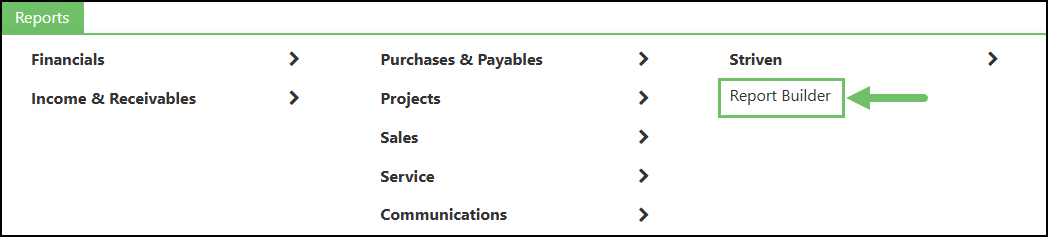
Menu Location of Report Builder

-
Reports List
The Reports page allows you to view the Custom Reports you have created, or that have been shared with you by other employees. You may utilize search filters and labels to narrow the results listed on this page. Information such as the Report Name, the dataset the report is based on, when the report was last run by, and who ran the report last are all available on this page. Actions related to individual reports such as Add, Edit, and Deactivate can be completed from the Reports page as well. Below is an image of the Reports page and a brief description of what you can accomplish here.
- Add: Opens the Add Report page allowing you to create a new Custom Report.
- Labels and Search: You can use these options to filter the Reports page by the labels you’ve created, or by using the Search option. The Search filters available are detailed in the section below.
- Sort: The reports listed may be sorted by the Default Sort, Name, and Last Run Date.
- Action Menu: Displays options based on the User and Report configurations.
- Reports Created by You: The actions available for reports you have created are Edit, Copy, Share, and Run.
- Reports Shared with You: If you have been provided with View Only access to the Shared Report, you will only have access to Run and Copy the report. If you have Full Access to the Report, you may Edit, Copy, Share, and Run the Report.
- Report Labels: If any labels have been associated with the report, they will be listed in this column. If no labels have been associated, this column will be blank.
- Deactivate: Deactivates and removes the report from the Reports page.
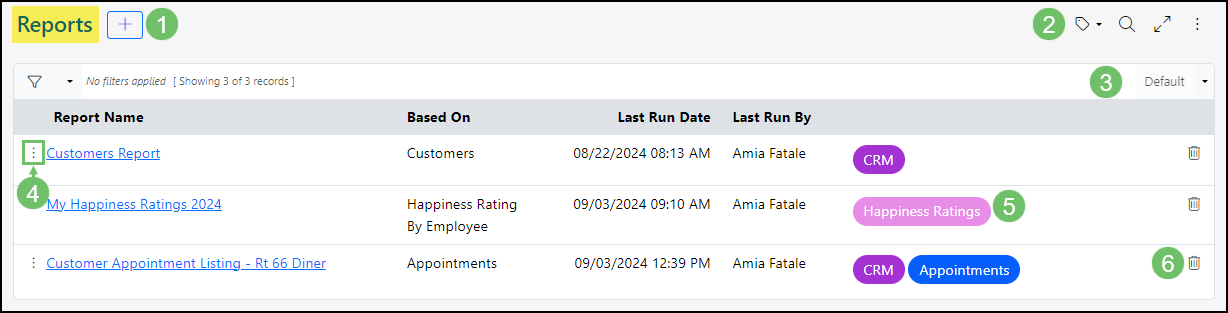
Example of the Reports Page
-
Reports Search
When filtering the results shown on the Reports page, you may utilize the following Search filters:
- Name: Allows you to filter by the report’s Name.
- Based On: You may filter the reports by the dataset they are based on.
- Created By: This filter allows you to only view reports created by selected Employees.
- Shared By: You may view Search results based on who shared the report with you.
- Status: Results may be filtered by the report’s status (Active or Inactive).
- Labels: Allows you to only view reports with specific labels assigned to them.
- API Access: Enables you to search for only reports which have API Access enabled.
- Shared: Filters to reports that have been shared with other users.
- View All: Checking this box enables you to view all available Custom Reports.
- Share Link Enabled: Narrows the search to only reports which have a Share Link enabled within the Share options.
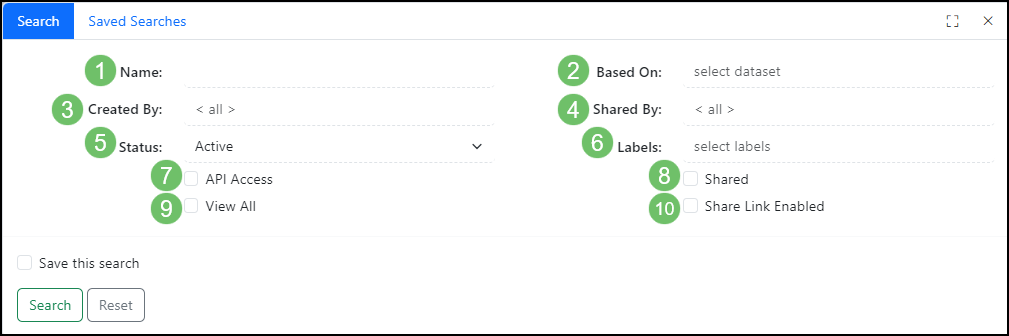
Image of the Search Filters Available on the Reports Page
-
Adding a New Report
Once the Add button has been selected from the Reports page, you will be able to create a new report using the Add Report page. There are several fields of information you will need to enter to create your report, such as the dataset to use for the report and the report’s name. You may also add a description detailing the purpose of the report, and any relevant labels for organization. Once the information has been added, you may select the green Proceed option to continue.
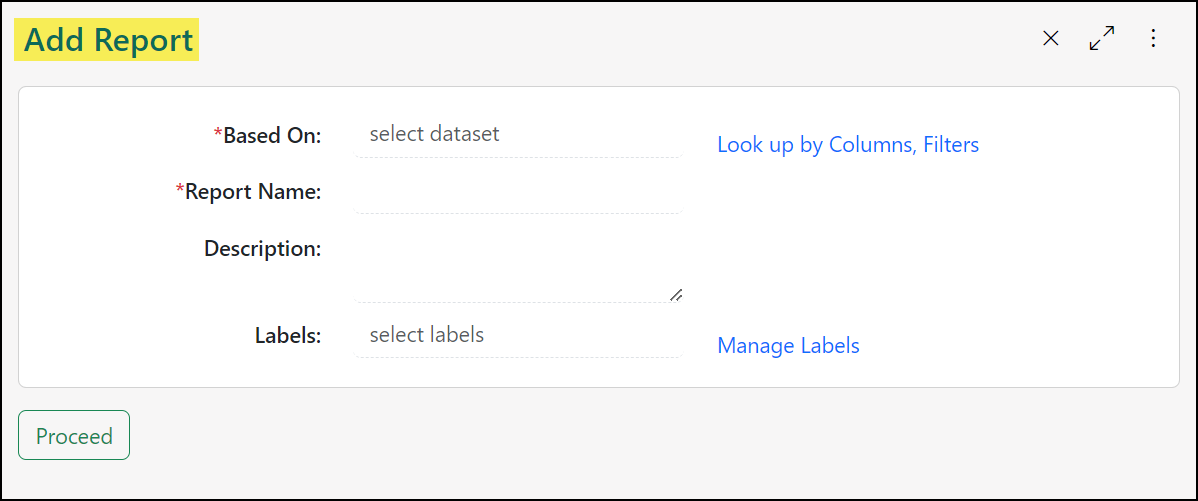
Example of the Add Report Page
-
Dataset Lookup
If you are unsure of which dataset to utilize for your report, you can utilize the Dataset Lookup feature by clicking on the hyperlinked “Look up by Columns, Filters” text located next to the Based On field when adding a new report.
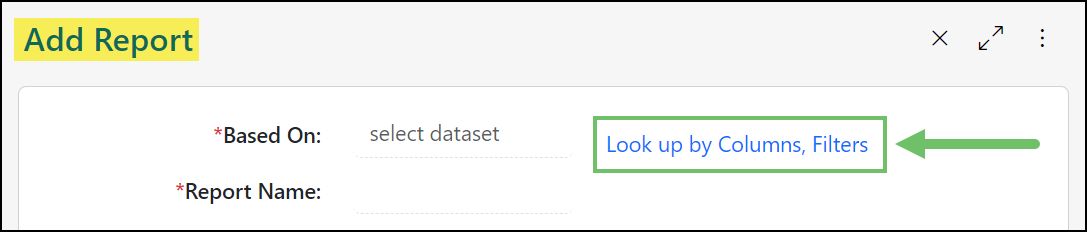
Example of the “Look Up By Columns, Filters” Option
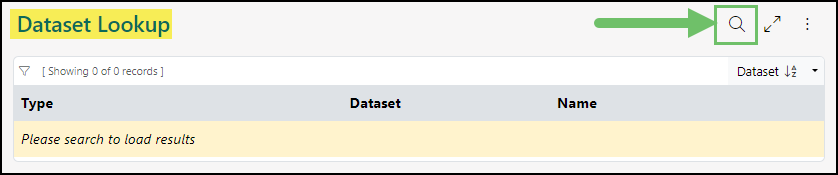
No information will be displayed upon first loading the page, as a search must be configured to generate results. Select the Search icon from the upper right hand corner of the page to configure your search parameters.
Example of the Dataset Lookup Tool
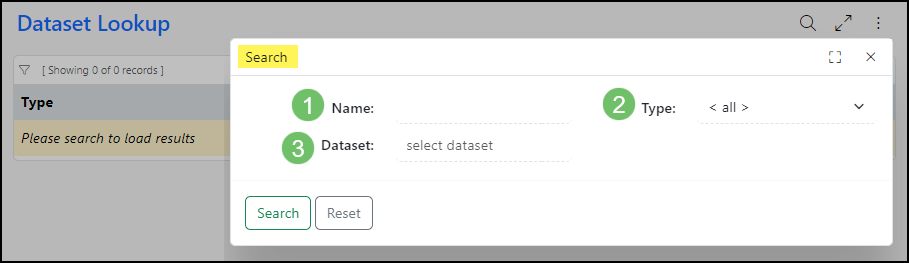
- Name:Allows you to search for a Column, Dataset, or Filter by name.
- Type:You can narrow the results of your search to a specific type. The type options are All, Filter, Column, Relationship.
- Dataset:Allows you to filter the results of Columns, Filters, and Relationships in relation to a specific dataset.
Example of the Dataset Lookup Search Options
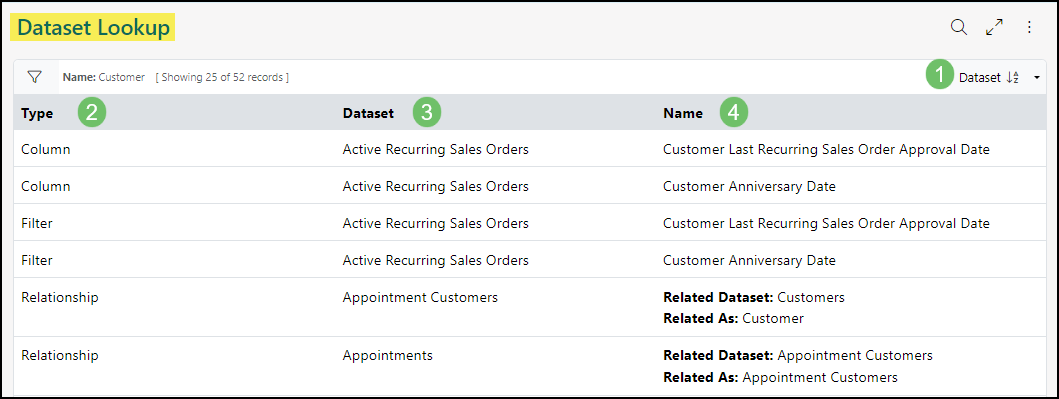
After your filters have been configured, you may run your search. The Dataset Lookup results will be sorted into 3 columns:
- Sorting: Allows you to choose how the results are sorted. You can choose to sort results ascending or descending by Dataset, Type, or Name.
- Type: Displays which entity type the result is. The Types which may be displayed are Column, Filter, and Relationship.
- Dataset: Lists the name of the dataset which the Column, Filter, or Relationship belong to.
- Name: Displays the name of the Column, Filter, or Relationship.
Example of the Dataset Lookup Tool
-
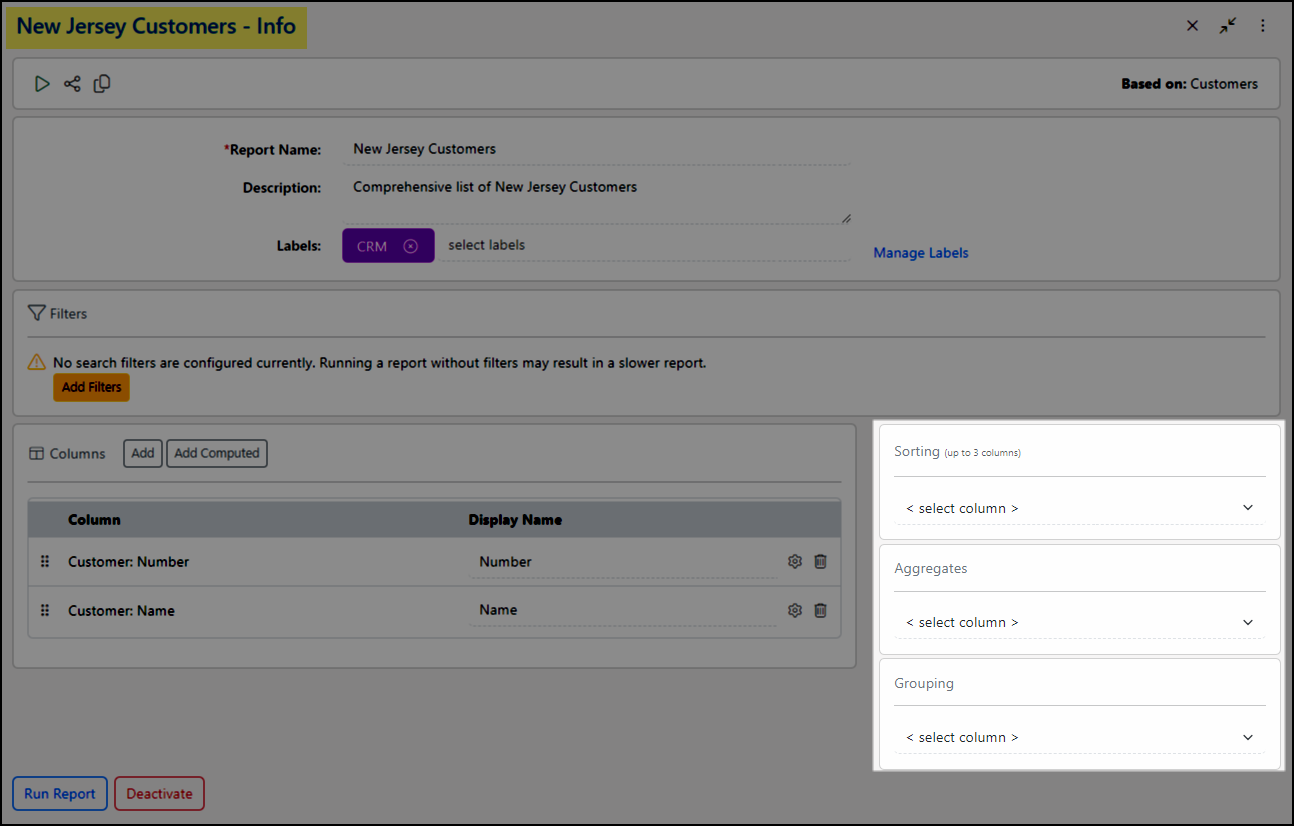
Report Configuration
The Report – Info (or Report Configuration) page allows you to add basic information, filters, columns, and more to customize your report. Each dataset contains columns and filters related to the topic of the dataset. You may also add columns and filters from related datasets provided they share a Relationship.
The functionality of the Report – Info page is detailed in the following sections. These sections include configuring filters and columns, sorting, grouping, and aggregation.
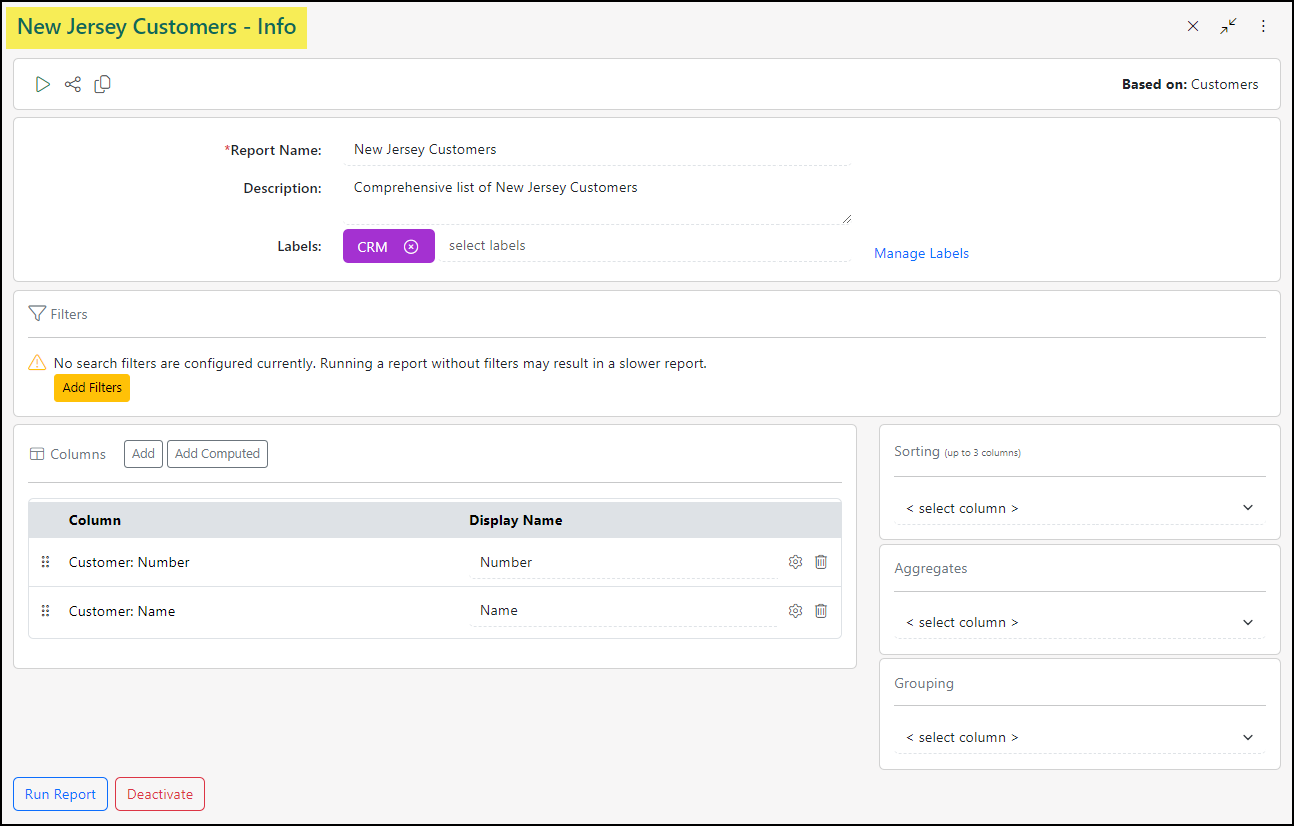
Example of the Report – Info Page
-
Report Information
The report’s Basic Info section contains actions and information that assist you in identifying details about your report and sharing the report with other users. The Name, Description, and labels you configured when creating the report can be viewed and edited here. The additional information and actions available in this section are detailed below:
- Run: Selecting this option will run the report.
- Share: This option opens the Report–Share page, offering numerous ways to share the report with users and non-system users.
- Copy: Allows you to copy this report information to a new report.
- Based On: Displays the chosen dataset for the report.
- Manage Labels: Allows you to add new labels, edit labels, and deactivate labels.
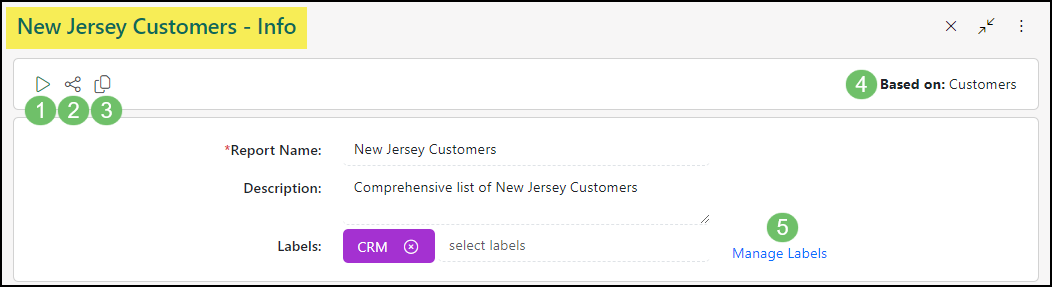
Example of a Report’s Basic Info Section
Managing Labels
To create and manage your labels, select the Manage Labels option located within the report’s Basic Info section to open the Manage Labels window. From this window you can view your existing labels, both active and archived, and access options related to each created label by selecting the kebab menu located to the right of the label. This menu contains options to Edit, Delete, Archive, and Make Public/Private. If you would like to create a new label, you may do so by utilizing the “Enter new label name” field at the bottom of the window.
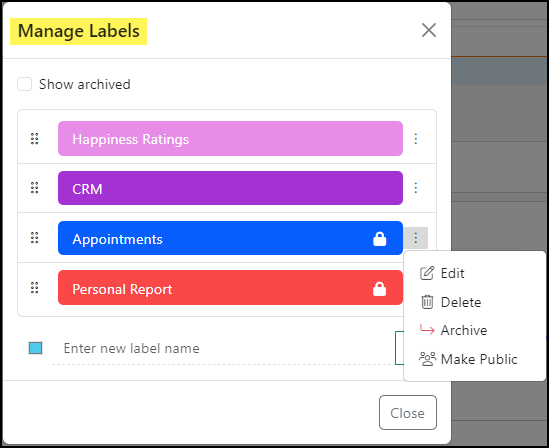
Example of the Manage Labels Window
-
Configuring Columns
Columns chosen for the report will contain and organize the data that will be generated by the report parameters. Standard Columns and Computed Columns may be added to the report, then reordered and renamed to your preferences. Information regarding configuring the different types of columns for your report are in the sections below.
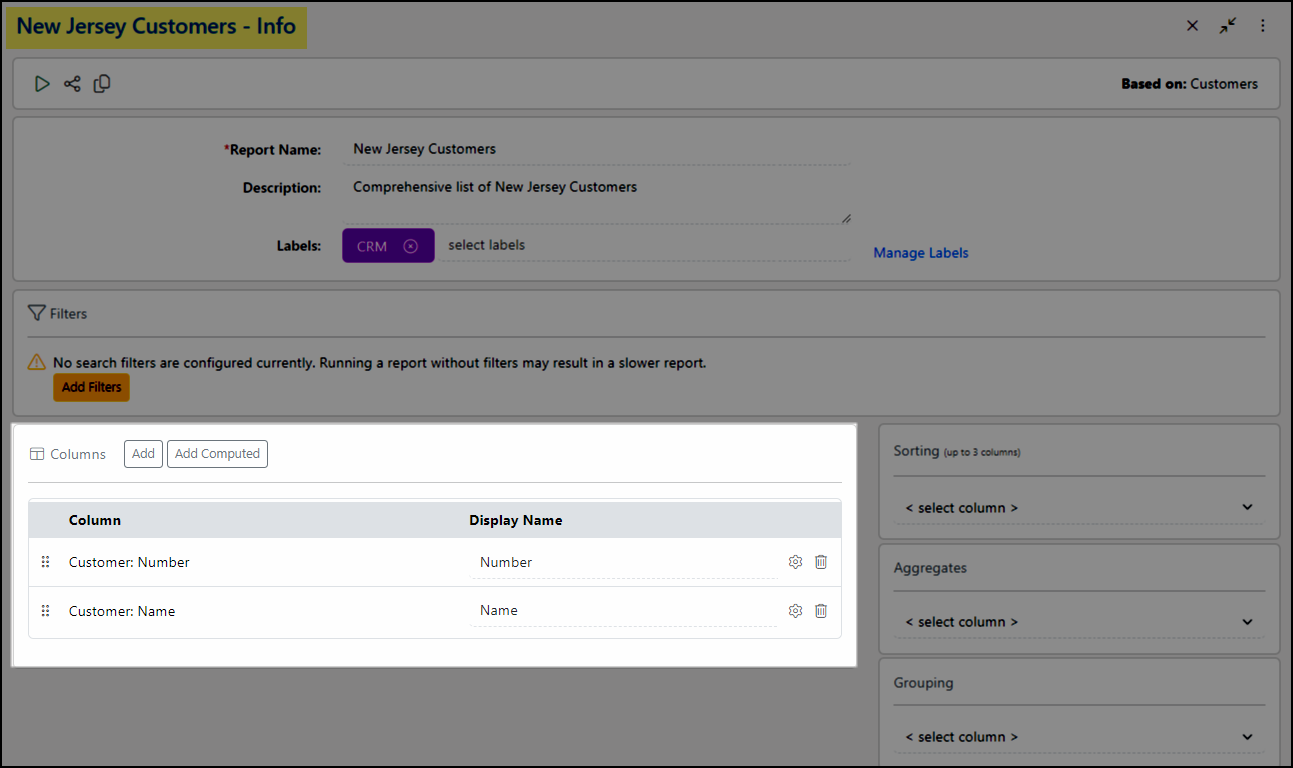
Example of the Columns Section of a Report
Standard Columns
Adding Columns to your report will allow you to see your data when the report is run. Using filters and columns in combination can create specific, and informative reports. To add columns to your report, select the Add option from the Columns section.
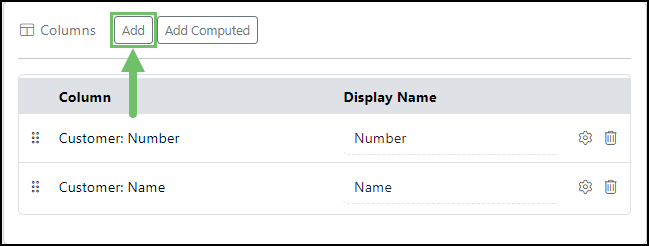
Example of the Add (Column) Button
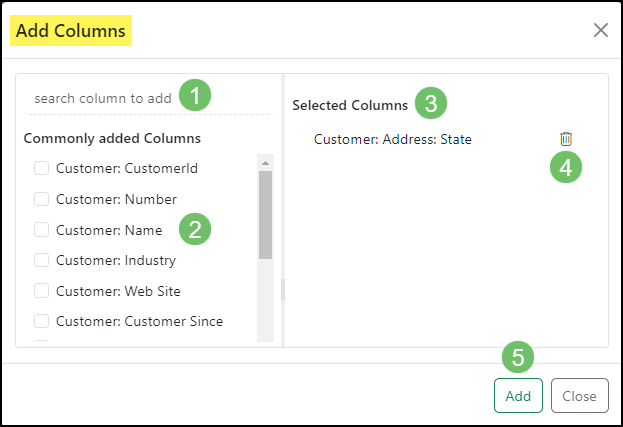
After selecting the Add button, the Add Columns pop-up window will open. The Add Columns window allows you to select columns to be added to your report.
- Search: You may use the Search field to find a column by name.
- Selected Columns: This section will display the columns you have chosen from the Available Columns list on the left side of the window.
- Column Results: Commonly added columns for the dataset you have chosen will be displayed by default. If you search for a column, the results of your search will appear instead. To select a column, select the checkbox next to the column name.
- Delete: Allows you to remove one of your selected columns.
- Add: To add these columns to your report, you must select the Add option. Selecting Close will not save your selections.
Example of the Add Columns Window
Computed Columns
Computed Columns allow you to add columns which use mathematical formulas related to columns on the report that contain quantitative data. To add a computed column to your report, select the Add Computed option from the Columns section.
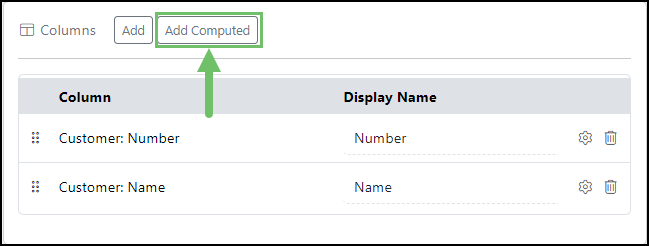
Example of the Add Computed Option
This will prompt an Add Computed Column window, where you may configure the following options:
- Name: Allows you to input a name for the computed column.
- Formula: The Formula field enables you to input a mathematical formula that will be run automatically using data from the column.
- Merge Fields: This drop-down menu allows you to insert merge fields to your formula for columns with quantitative data which are present on your report.
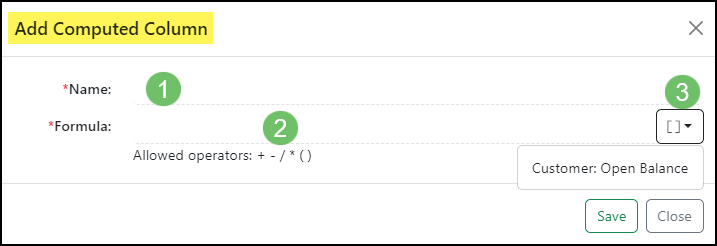
Example of the Add Computed Column Window
-
Configuring Filters
Filters can be used to narrow the field of data your report will display by opting to include or exclude specific data. If no filters have been selected for your report, a message will appear stating that “Running a report without filters may result in a slower report”, as there will be a larger field of data for the report to load upon running.
To begin adding filters, select the Add Filters button from the Filters section.
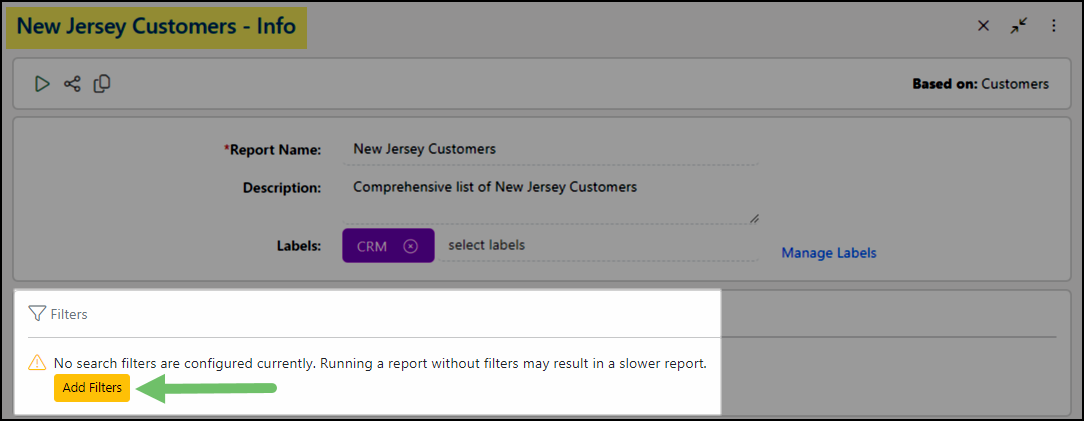
Example of the Add Filters Option
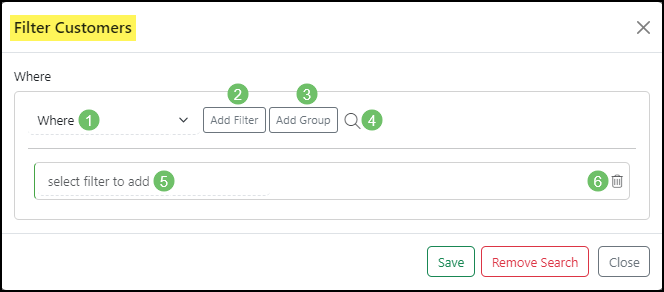
Once open, the Filter Dataset window allows you to create filter groups, where you can choose if your filters will be based on Where, Where Either, or Excluding logic. The Select Filter field features a type-ahead search index, which can be used to find specific filters related to the dataset chosen for the report.

Example of Adding a Filter to a Report
Options available when configuring a Filter:
- Filter Type: Clicking this drop-down menu lets you choose how you want to filter your report results. Options include:
- Where: Shows all results for the selected filters.
- Where Either: Shows the filters selected and others as long as the other options are not using Excluding.
- Excluding: Excludes results matching the filters selected.
- Add Filter: Adds another filter to the existing group to narrow report results.
- Add Group: Allows you to select another filter type.
- Dataset Lookup: Opens the Dataset Lookup tool for your reference, this can assist in finding the appropriate filters for the dataset you have chosen.
- Select Filter to Add: This field enables you to choose a filter from within your dataset or a related dataset.
- Delete: Allows you to delete a configured filter.
Example of the Filter Reports Window
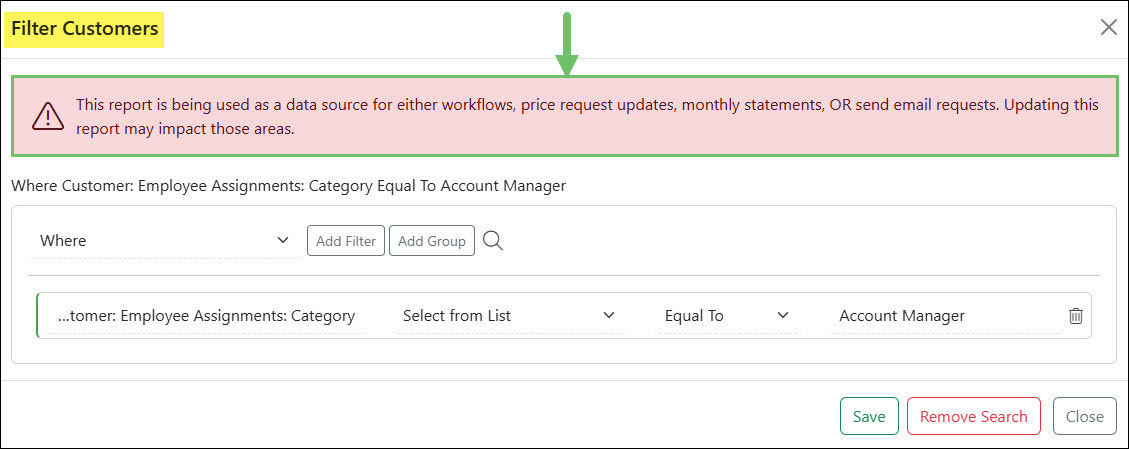
Report In-Use Alert
When working with report filters available with the Report Builder, you may occasionally encounter a notification banner stating:
“This report is being used as a data source for either workflows, price request updates, monthly statements, OR send email requests. Updating this report may impact those areas.”
This informational alert appears when you are attempting to configure or adjust filters for a report that is currently processing or actively being utilized by another system action or user.
Example of the Report Builder In-Use Alert When Viewing Filters
Dataset Relationships
Dataset Relationships identify datasets that may have related information. These are important to note as they allow you to create in-depth filtering and columns for reports. Some datasets you may see as Relationships are not available for individual selection, such as Addresses and Emails, as these datasets are used to parse information related to entity specific datasets like Customers. When viewing a filter or column that uses relationships, the primary dataset will be listed first, followed by up to three levels of relationships, then the field from which the data is being gathered. In the example below, the filter “Customer: Address: State” shows that the primary dataset is Customers, with the related dataset of Address, and the field being parsed is State.
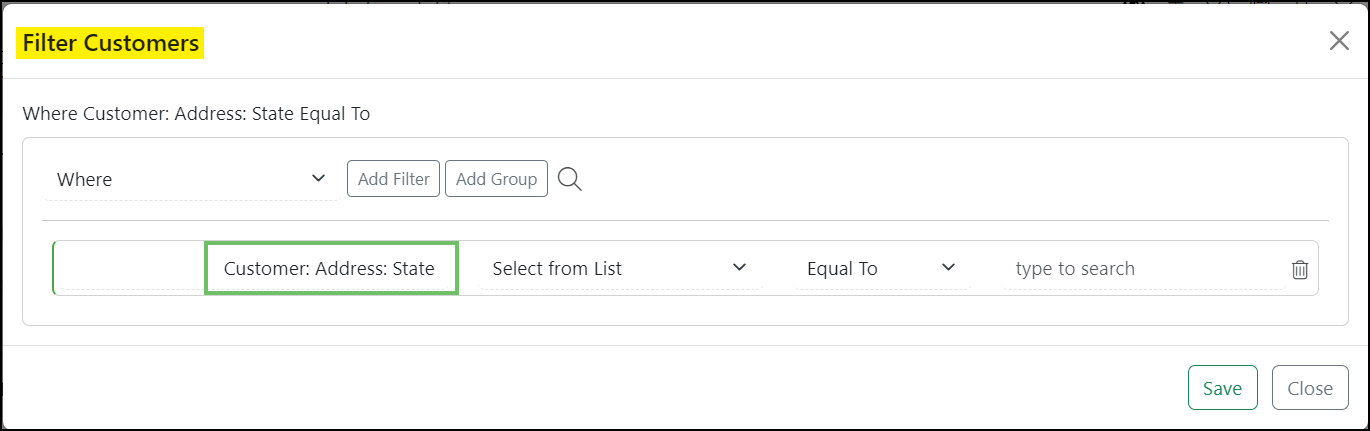
Example of a Report Filter Using Relationships
- Filter Type: Clicking this drop-down menu lets you choose how you want to filter your report results. Options include:
-
Sorting, Aggregation, and Grouping
Once your columns and filters have been configured, you may add optional organization to the report such as Sorting, Aggregation, and Grouping. These options can assist you in building detailed reports with enhanced viewability, and automated calculations. You may read more about Sorting, Aggregation, and Grouping in the sections below.
Example of the Sorting, Aggregation, and Grouping Options
-
Sorting
Sorting will determine how the report data is displayed when run. When adding a sorting method to your report, you may choose to have your data arranged by up to 3 columns.
- Select Column: Allows you to choose the column you would like to sort the report data by.
- Selected Columns: As you select columns for your sorting, they will be listed here. You may also rearrange the sort order of these columns using the toaster pastry icon to the left of the column name.
- Sort Direction: The column chosen may be sorted in ascending or descending order.
- Remove Sorting Selection: Allows you to remove the sorting option you have configured.
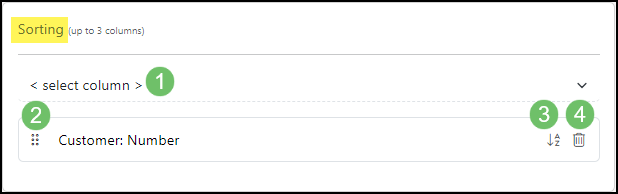
Example of the Sorting Options Available
-
Aggregation
If you are reporting on numerical values, Aggregation can assist in automatically calculating basic totals per report, or report. The values can include transaction amounts, Task hours, item costs, and more. Below is an image of the Aggregates section and a brief description of what you can configure here.
- Select Column: Allows you to choose the column whose total you would like to aggregate.
- Selected Columns: As you select columns to aggregate, they will be listed below with their own aggregation options.
- Aggregation Options: This drop-down menu allows users to choose how they aggregate results. Options include:
- SUM: Adds your results per group and per report.
- AVG: Averages your results per group and per report.
- MIN: Displays the minimum value of your results per group and per report.
- MAX: Displays the maximum value of your results per group and per report.
- Remove Aggregation Selection: Allows users to remove the aggregation option.
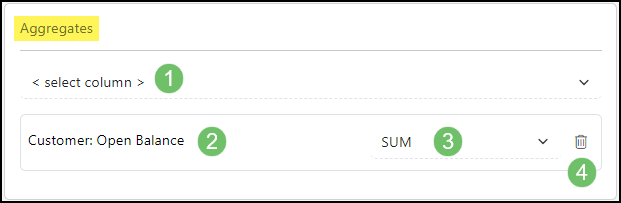
Example of the Aggregation Options Available
-
Grouping
If you would like the report data to be organized based on related data from selected columns, Grouping will automatically group this information into expandable and collapsible sections. You may use the options featured in the image below to customize the amount of detail displayed within these groups.
- Select Column: Allows you to choose the column whose data you would like to group.
- Selected Columns: The columns you select to use for grouping the report data will be displayed here.
- Show Count: When checked, this option will allow the group header to display the number of total results within the group.
- Remove Grouping Selection: Allows you to remove the configured grouping option.
- Hide Details: This option allows the report data to be grouped by the selected columns, all other columns will be hidden. If aggregation has been selected, the aggregation totals will be displayed per group.
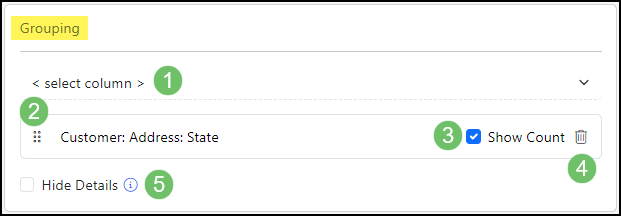
Example of the Grouping Options Available
Within the Columns section, it is indicated which columns are being used for Sorting, Grouping, or Aggregation as indicated by the blue labels in the image below.
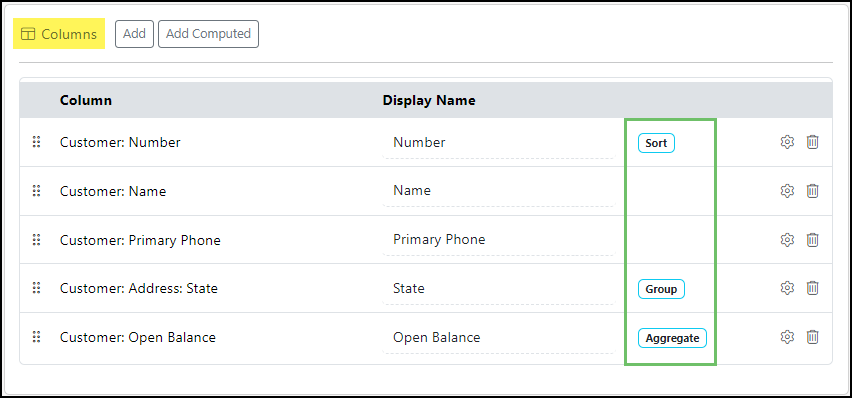
Example of Sorting, Aggregation, and Grouping Labels in the Columns Section
-
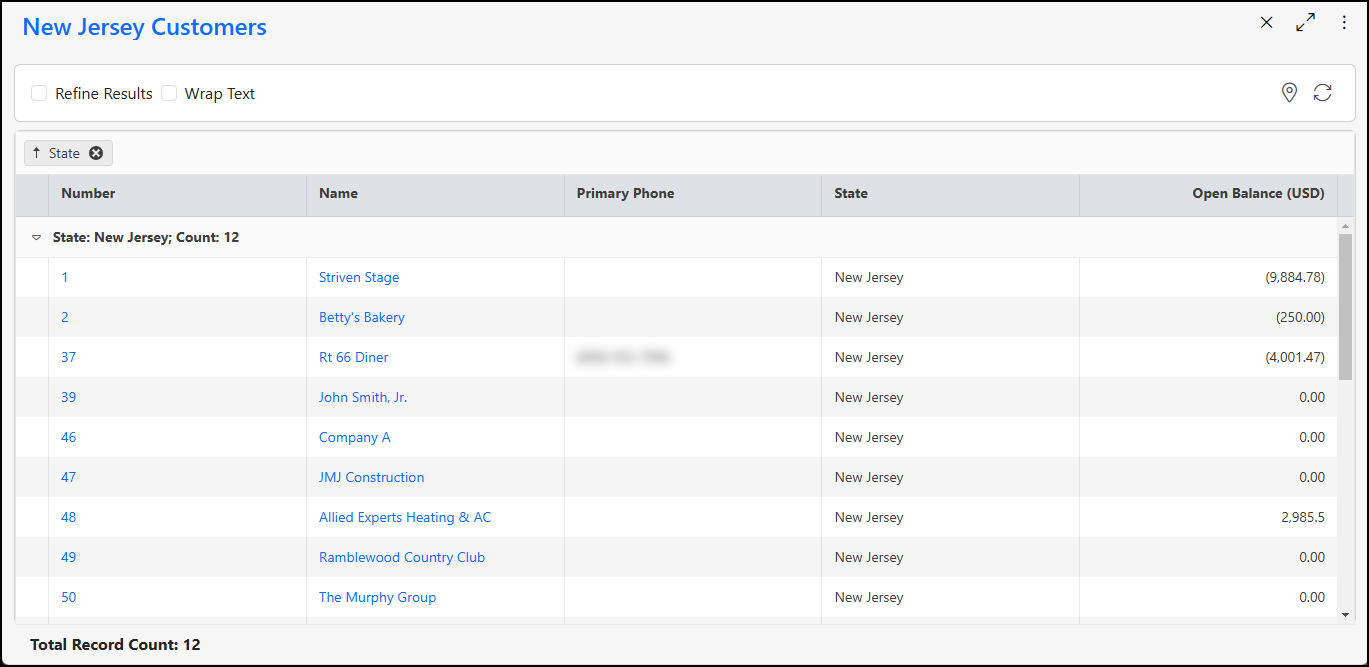
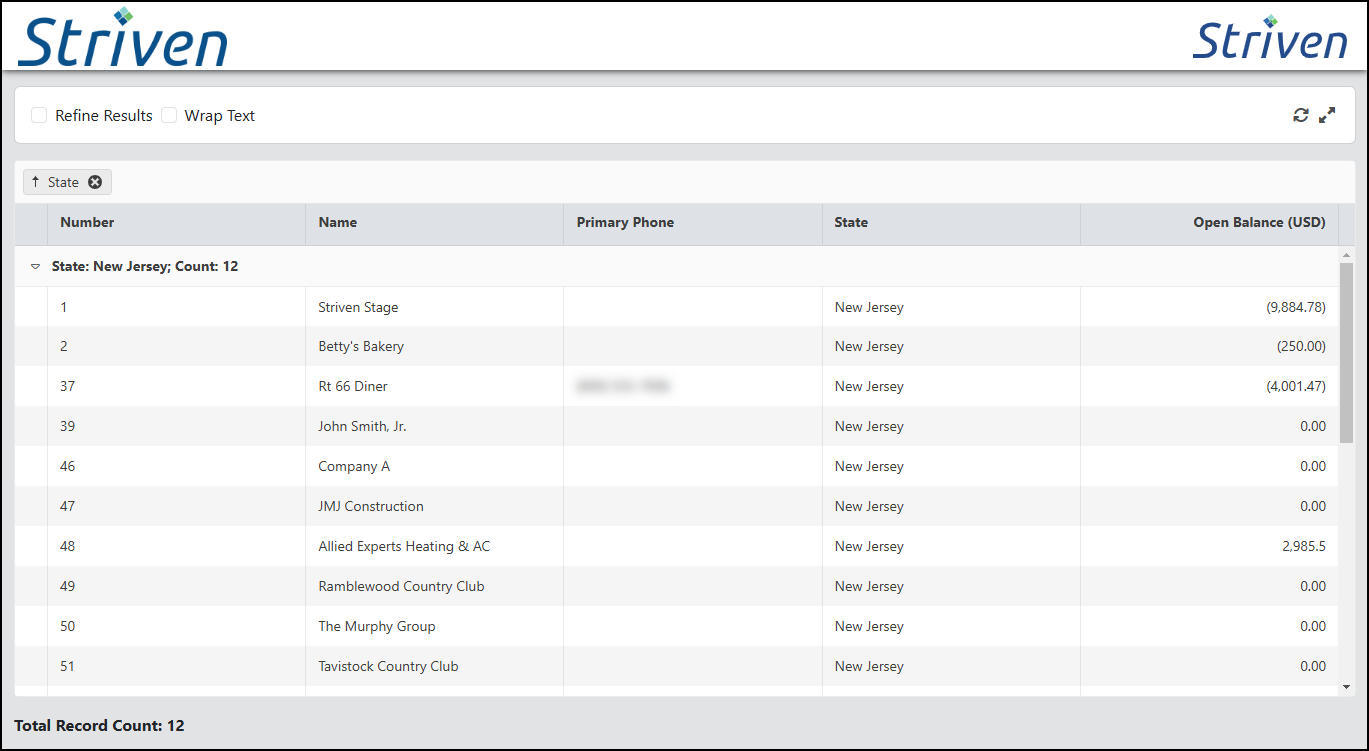
Running Your Report
After you have configured all the options for your report, you may use the Run Report icon located at the top or bottom of the page to run your report. The Report Results page will open in a new browser tab list all of the appropriate data based on the filters you have chosen. The Report Results screen includes tools you can use to share your report, shrink or expand column widths, and more. Below is an image of an example report, what the results could look like, and a brief description of what can be accomplished here.
- Refine Results: Allows you to search within the report’s columns to find data while viewing results.
- Wrap Text: Selecting this option allows the text within each column to wrap. Wrapping the column text will prompt the report to become paged, with a maximum of 50 results listed per page.
- Filter: Filters the report while viewing the results.
- Edit: Redirects you back to the Report – Info screen where you can alter your report.
- Share: Provides many options to share the report with users and non-system users.
- Map IT: For report data that includes Locations, the Map It option allows you to view your report data as pins on a map.
- Refresh: Triggers a refresh of the report results to show the most up to date information.
- Export: Enables you to export your report results to a .CSV, .PDF, or .XLSX file.
- Note: Groups and aggregation results will not populate to the exported .CSV file.
- Headers: Displays the names of your chosen columns.
- Grouping: If you have configured groups on your report, the group header will display. You may expand or collapse the group using the triangle icon next to the group name.
- Report Data: Report data such as Customer names, Customer IDs, Sales Order numbers, and more are hyperlinked. Selecting a hyperlinked result will allow you to view related information. This related information will populate in a new browser tab.
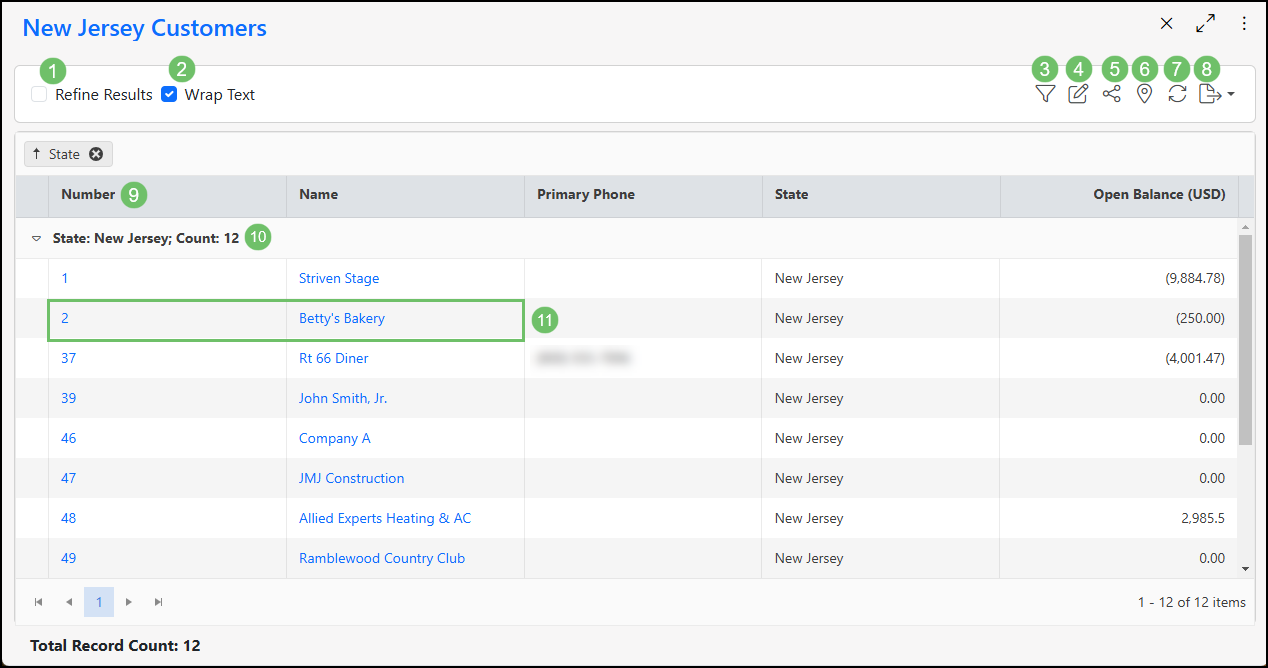
Example of the Report Results Page
-
Map IT
The Map IT feature is available on reports that contain geographic information. Map IT allows you to view report data as pins on a map, allowing you a visual of all the results in a specific area. You can use the Map IT icon from the upper right corner of the report to view a map of your data.
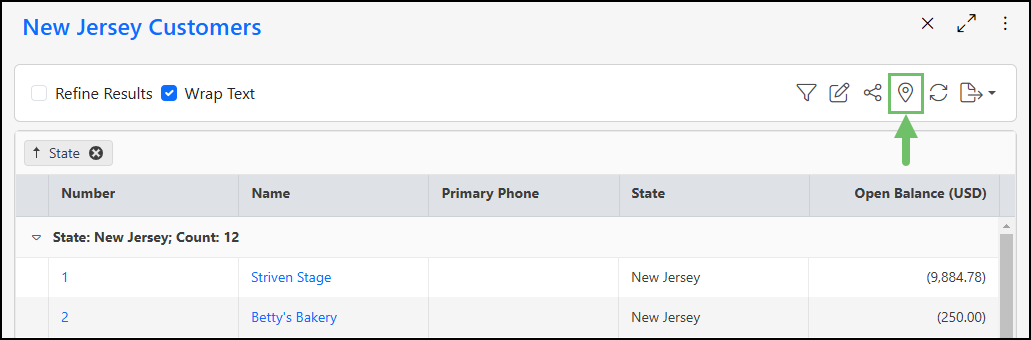
Example of the Map IT Option on a Report
When the map opens, your report results will appear as red pins on the map. Selecting a pin will allow you to view the Location Address, and the type of report data at that address such as Customers, Employees, Projects, Sales Orders, and more. The location address is hyperlinked, allowing you to select the address for quick directions through Google Maps.
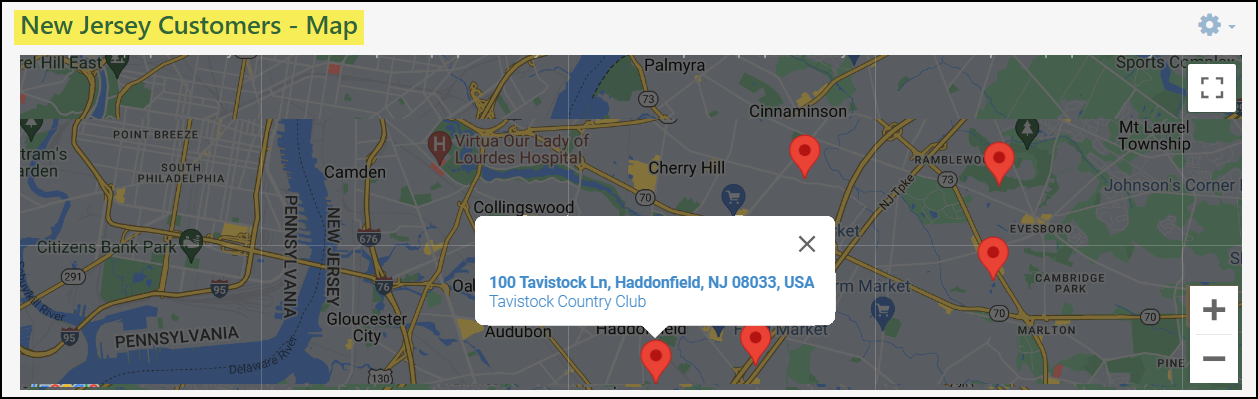
Example of Report Data on the Map
-
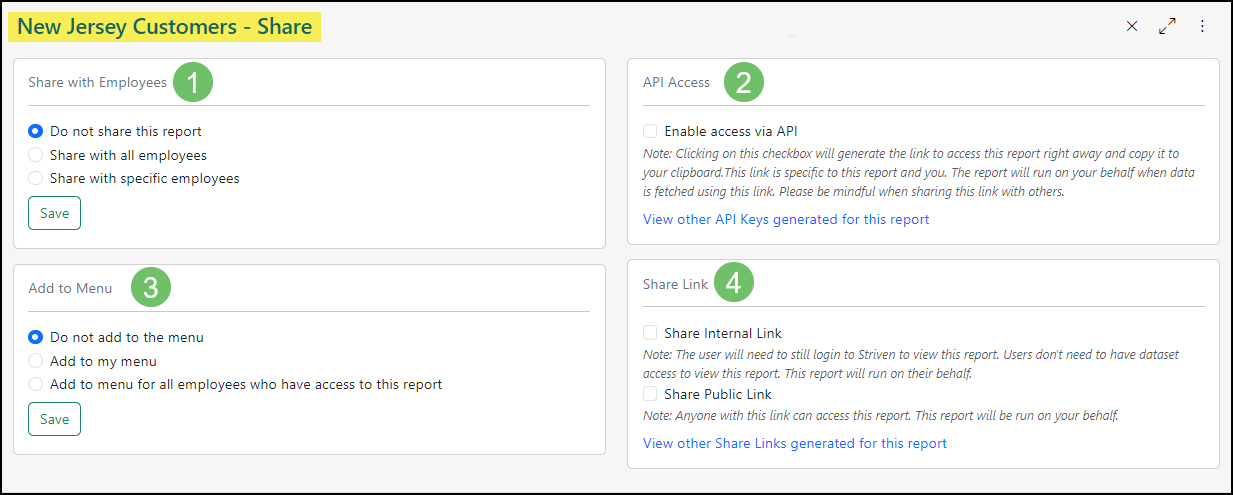
Sharing Reports
Selecting the Share option located on a report will allow you to view the Report – Share page and it’s capabilities. The functions available on the Report – Share page are detailed below.
- Share with Employees: You may share this report directly with Employees, Teams, Job Titles, or Departments, and choose whether they have edit access to the report.
- API Access: Allows you to enable API Access for the report, view active API Keys, and revoke API Access.
- Add to Menu: Using these options you can add the report to the Reports menu for yourself and other users for quick accessibility
- Share Link: Generates a Public or Internal Share Link, so you may easily share the report with other users, and non-system users.
Example of Report – Share Page
-
Internal Share Links
If you would like to share your report with other Striven users that may not have access to the report’s dataset, you may do so using the Internal Share Link option within the Share Link section of the Report – Share page.
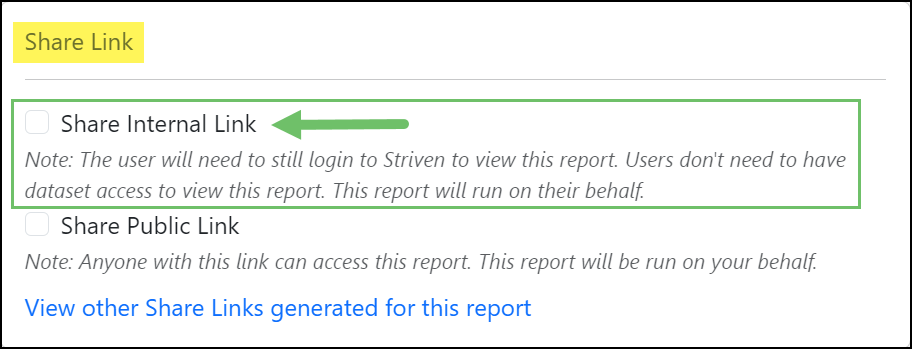
Example of the “Share Internal Link” Option
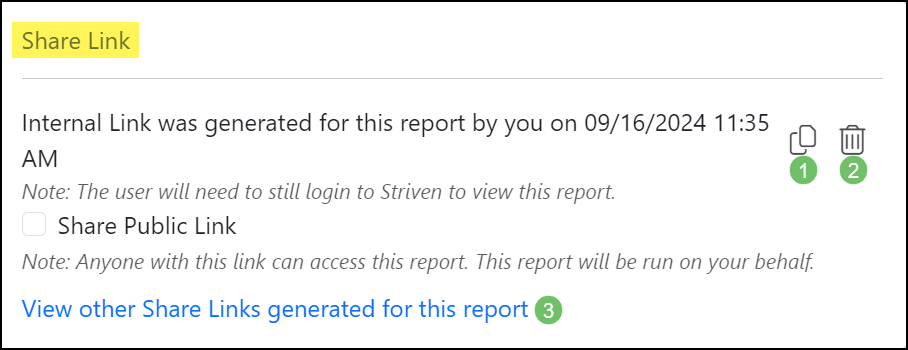
Checking the box will generate an Internal Share Link that you may copy to your clipboard using the Copy icon to share with other users. When accessing the Share Link, users will be required to login to Striven to access the report.
- Copy: Allows you to copy the Internal Share Link to be shared with other users.
- Delete: Removes and deactivates the Internal Link to the report. Once deleted, the report can no longer be accessed with the link, and a new one will need to be created if you would like to share the report again.
- View other Share Links generated for this Report: Users with access to edit the report also have access to generate Share Links. This option allows you to view a list of any other Share Links generated for the report.
Example of the Internal Share Link Options
When viewing the Internal Share Link, the user you have shared the report with may use the Refine Results option, view the Map IT results (if applicable), and refresh the report. It is important to note that reports cannot be exported via Share Links.
Example of Viewing the Internal Share Link as a User
Access Denied
If you have accessed a Report that has not been shared with you, an Access Denied page will be shown. This automated security screen is designed to protect sensitive data while informing you why the content is unavailable. To facilitate collaboration, the system will explicitly display the name of the Report Owner. This transparency allows you to identify and reach out to the appropriate person to request the necessary permissions to gain access and complete your assigned work.
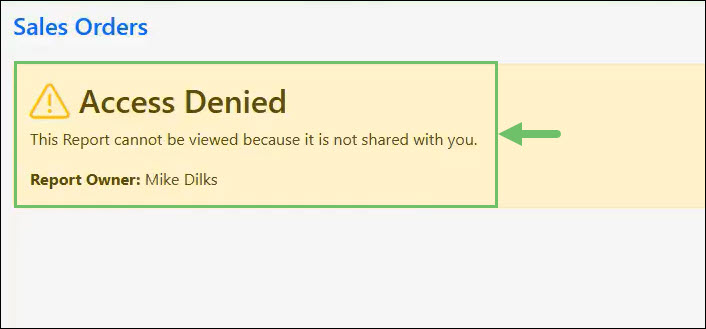
Example of the Access Denied Page for the Report Builder
-
Public Share Links
Public Share Links may be generated to allow non-system users access to view the report you have created within Striven. The actions available from a Public Share link are limited to refining results and refreshing the Report. Anyone with the Public Share Link may access the report and run it on your behalf. To generate a Public Link, check the Share Public Link option located within the Share Link section of the Report – Share page.
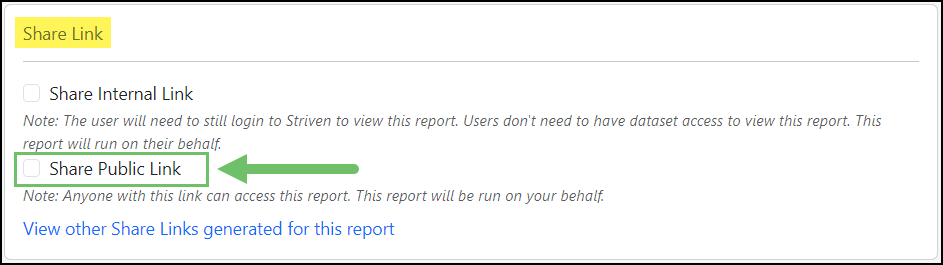
Example of the “Share Public Link” Option
Once the Public Share Link has been generated, there are several actions which can be taken:
- Copy: Allows you to copy the Public Link to be shared.
- Delete: Removes and deactivates the Public Link to the Report. Once deleted, the report can no longer be accessed with the link, and a new one will need to be created if you would like to share the report again.
- View other Share Links generated for this Report: Users with access to edit the report also have access to generate Share Links. This option allows you to view a list of any other Share Links generated for the report.
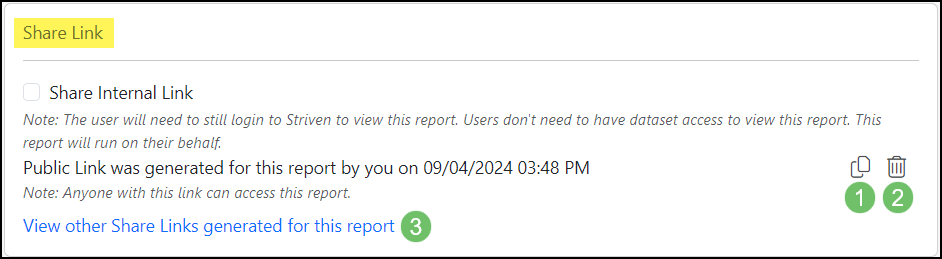
Example of the Public Share Link Options
Below is an image of how the Public Share Link displays when accessed by a non-system user.
Example of Viewing a Public Share Link
-
API Keys
API Keys in Striven allow you to export data from any report dataset to external platforms, such as Google Sheets. Because these keys refresh data every 15 minutes, your shared reports stay automatically updated without manual intervention.
- Note: To use this feature, API Access must be enabled in your system settings, with at least one key designated for Report Builder calls. For detailed instructions, please refer to our API Settings Guide.
-
Enabling API Keys
To enable a report API Key, navigate to the Report – Share page by clicking on the Share icon located in the top left corner of the Report – Info page, just below the Report Name.
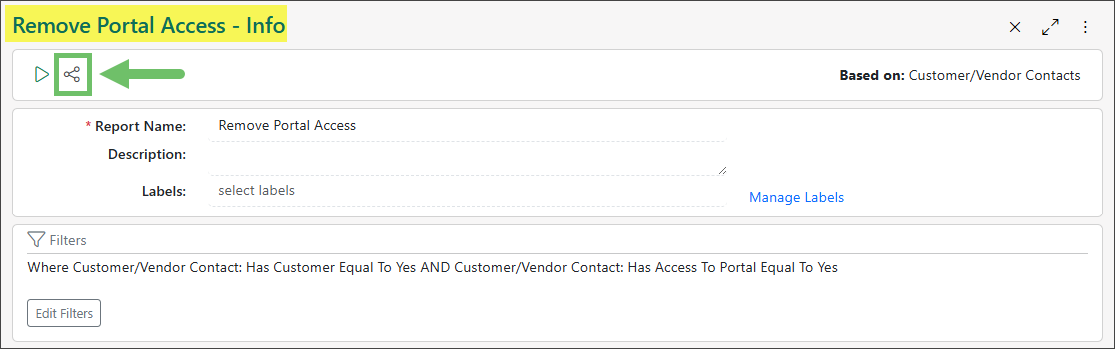
Example of the Share Button on the Report – Info Page
Once the Report – Share page is displayed, check the Enable access via API box in the API Access panel of the page.
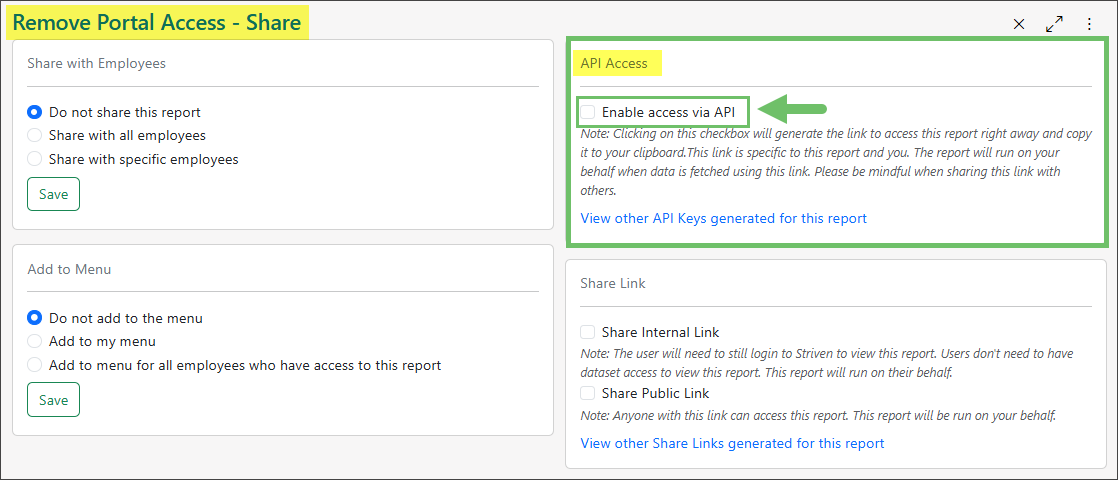
Example of the Enable Access Via API Setting on the Report – Share Page
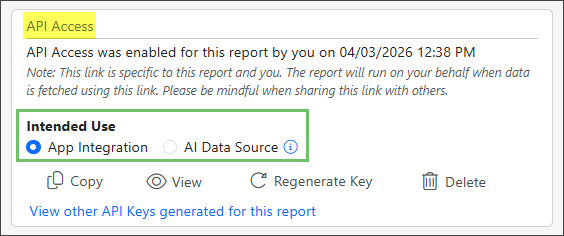
Intended Use
When setting up your API Key, you can choose how your data is packaged. Select the option that matches where your data is going.
- App Integration (Software-to-Software): This option is best for connecting to structured tools, like Google Sheets, Power BI, or Zapier. It works by sending raw, “flat” data in columns and rows. It requires mapping to tell the destination app exactly which column goes where. It uses IDs, raw codes, and numbers that are easy for other computer programs to sort, filter, and calculate.
- AI Data Source (Software-to-Intelligence): This option is best for connecting to AI agents, Custom GPTs, or other “chat with your data” type tools. It works by sending your data in a text/html format, including the raw data, but also labels and structure to tell the AI tool what to do with the information, essentially describing the report to the AI. Because it uses html tags and text to identify headers and values, the AI can “read” and understand the meaning of the report, rather than just seeing a list of values.
- Note: Most AI tools take a static snapshot of this link. If your Striven data changes, remember to use the Sync or Refresh button within your AI tool to pull the latest data.
Example of the Intended Use options in the API Access Panel of the Report – Share Page
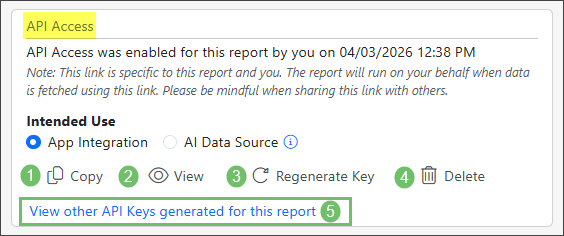
API Access Actions
The image below provides a brief overview of the actions that become available after the API Key has been generated.
- Copy: Copies the API Key URL to your clipboard.
- View: Enables you to view the API Key URL.
- Regenerate Key: Allows you to create a new API Key.
- Delete: Removes API Access using the Key and removes access to the report data from anyone using the API Key.
- View other API Keys generated for this Report: If the report is shared with your Employees, you may view any API Keys generated for this report by other users.
Example of the API Access Panel of the Report – Share Page After an API Key Has Been Enabled
-
Exporting Reports
Custom Reports can be exported to .CSV, .PDF, and .XLSX file types, allowing them to be easily shared by email or printed. You can export your report by selecting the Export button from the Report Actions bar, then choose your preferred file type from the drop-down menu. A .PDF cannot be exported if Grouping is included on the Report.
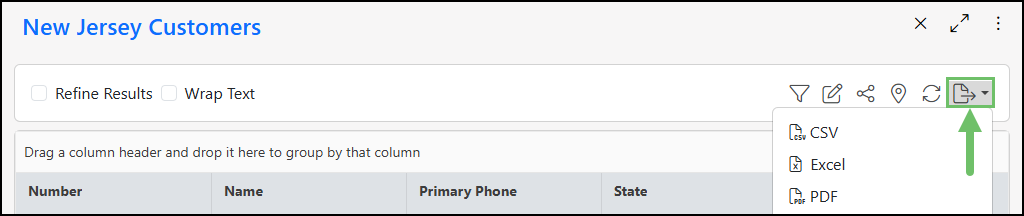
Example of the Export Option in a Report
-
Custom Report Header Formats
Striven offers customization to your Exports by allowing you to configure Custom Report Header Formats. These formats function similarly to Invoice and Task Formats by using HTML to style your header. To begin configuring your Custom Report Header Format, navigate Company > Settings > Company > Customizations > Custom Report Header Formats.
The Custom Report Header Formats List page contains multiple actions you may use to create and manage your Custom Report Header Formats. The image below displays how the List page appears and highlights the options available.
- Add: Allows you to create a new Header Format.
- Search: Allows you to narrow the results shown on the Custom Report Header Format List page.
- Sort: Arranges the list of created Formats ascending or descending by Name.
- Custom Report Header Format Name: Allows you to view and edit the Format Content.
- Copy: Allows you to copy the Format Content to a new Format.
- Deactivate: You may use the Trashcan icon to deactivate the selected Format.
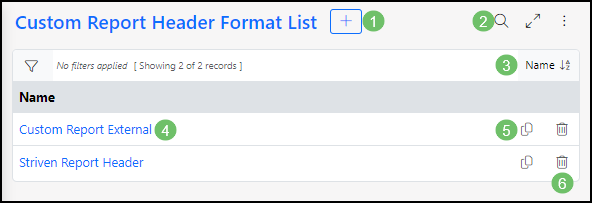
Example of the Custom Report Header Format List
To begin creating a new Custom Report Header Format, select the Plus icon from the top of the page.
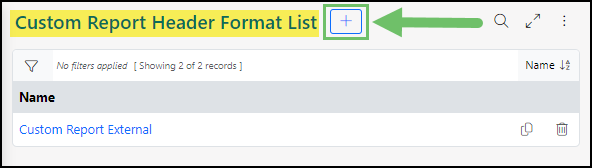
Example of the Add New Format Button
When adding a new Header Format, you will be directed to the Add Custom Report Header Format page where you can input a name for your Format to make it easily identifiable when exporting a report. You may also choose the height of the header in centimeters. To save the Format information, and begin adding content, select the Next option.
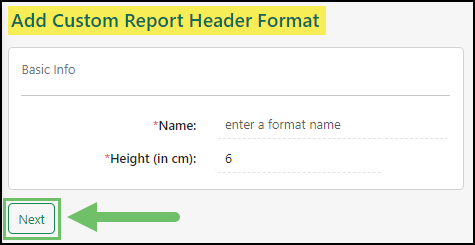
Example of the Add Custom Report Header Format Page
The Custom Report Header Format – Info page can be used to edit the details of your Header Format. There are several important options available on the page to assist you in creating and managing your Format, which are detailed below.
- Edit Basic Info: Allows you to change the name of the Format.
- Add Section: Allows you to create a new section which houses your Header Format’s content.
- Note: This option is only available when no there are no existing content sections added to the format.
- Section Name and Type: Displays the name and type of the section. Selecting the section’s name enables you to view and edit the content added to that section.
- Deactivate Section: Removes the section from your Format.
- Deactivate: Using the red Deactivate button will deactivate the entire Format.
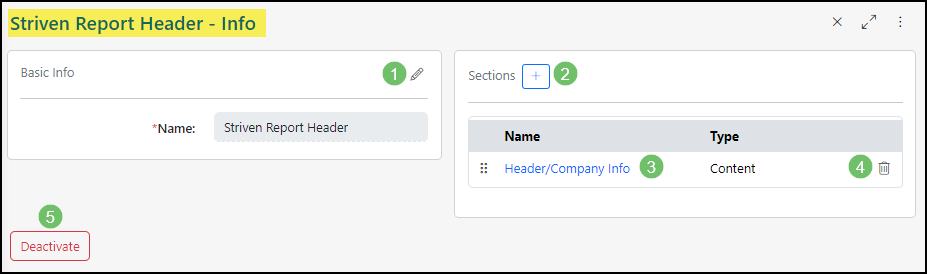
Example of the Custom Report Header Format – Info Page
When adding a new section to your format, you may add a name for the section, and add content to the section’s body using a rich text editor. There are merge fields available with information relevant to your report such as Company Name, Company Logo, Report Name, Report Filters, and more.
- Note: External images placed within the content of your Header Format will not be present when printed.
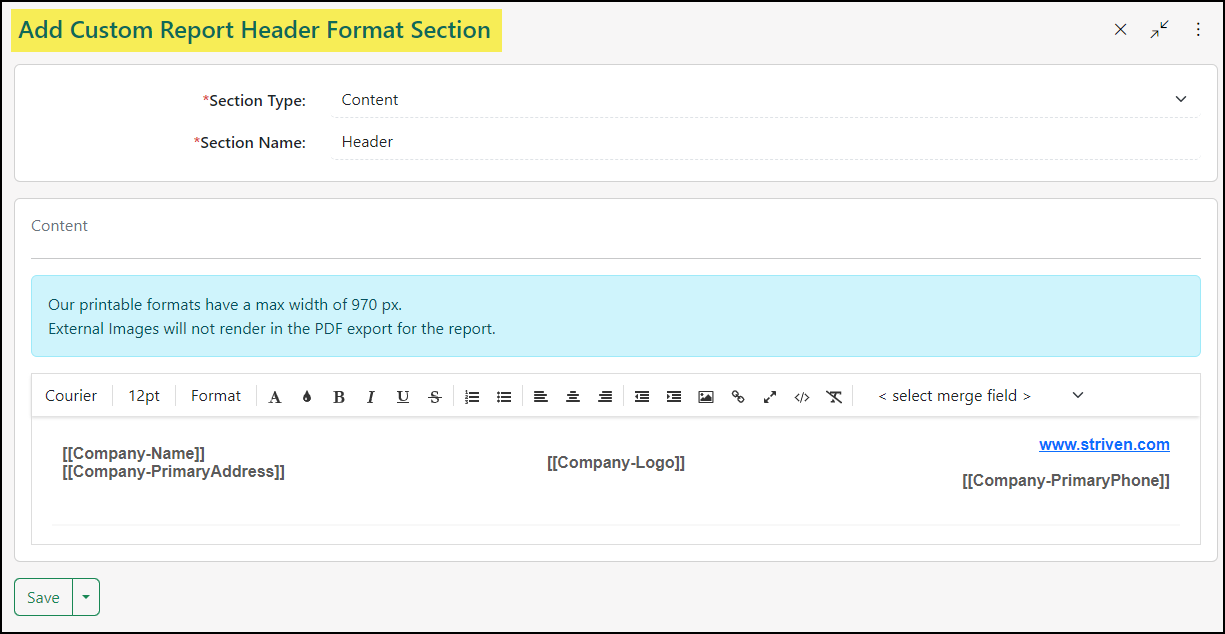
Example of Adding a Section to a Custom Report Header Format
When exporting the report, you can choose to export with one of your Customer Report Header Formats by utilizing the drop-down Export menu.
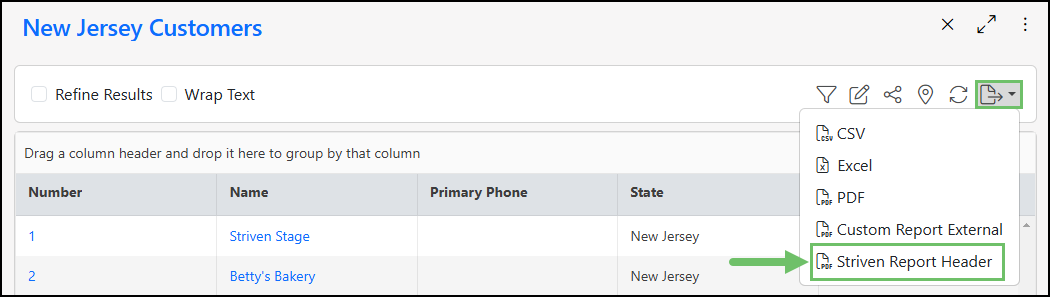
Example of Exporting a Report with a Custom Report Header Format
- Note: If a report exceeds 10,000 rows of data, the only export options available will be CSV or Excel. Custom Report Headers and PDF formats will not be available.
-
Recap
With this guide, we’ve discovered how to build reports within your Striven system. We’ve discovered ways to sort, filter, group, and aggregate results. We have also covered sharing reports, and exporting reports with Custom Header Formats. By using the information learned here, you can start building reports on the data you’d like to view and sharing them with people who need access.
Have a Question?
Ask the Striven Community
User-sourced how-to’s, feedback, and more!
FAQs
-
Can I build a report on what I have imported into the system so far?
To report on previous imports, you can use the Import History function, which can be found on any import page found in Striven. To learn more about the Import History function you can reference the Import Management Guide.