
Custom Reporting
Your data, your way. Stop waiting for IT—build reports yourself.
From Raw Data to Actionable Insights
Anticipate trends, understand customer behavior, and make informed predictions. Welcome to a world where data not only informs but drives your business growth.
Every Report At Your Fingertips
Capture the power and versatility of a modern ERP system.
From detailed financial insights and real-time inventory levels to comprehensive sales analyses and precise project management tracking, Striven gives you the answers you need.
With Striven, you can report on:
- Financial Data
- Service & Job Metrics
- Sales Metrics
- Inventory Levels
- CRM & Sales Numbers
- Projects & Tasks
Accelerate Your Growth Through Data
When all of your data is in one place, you get a single, accurate version of the truth.
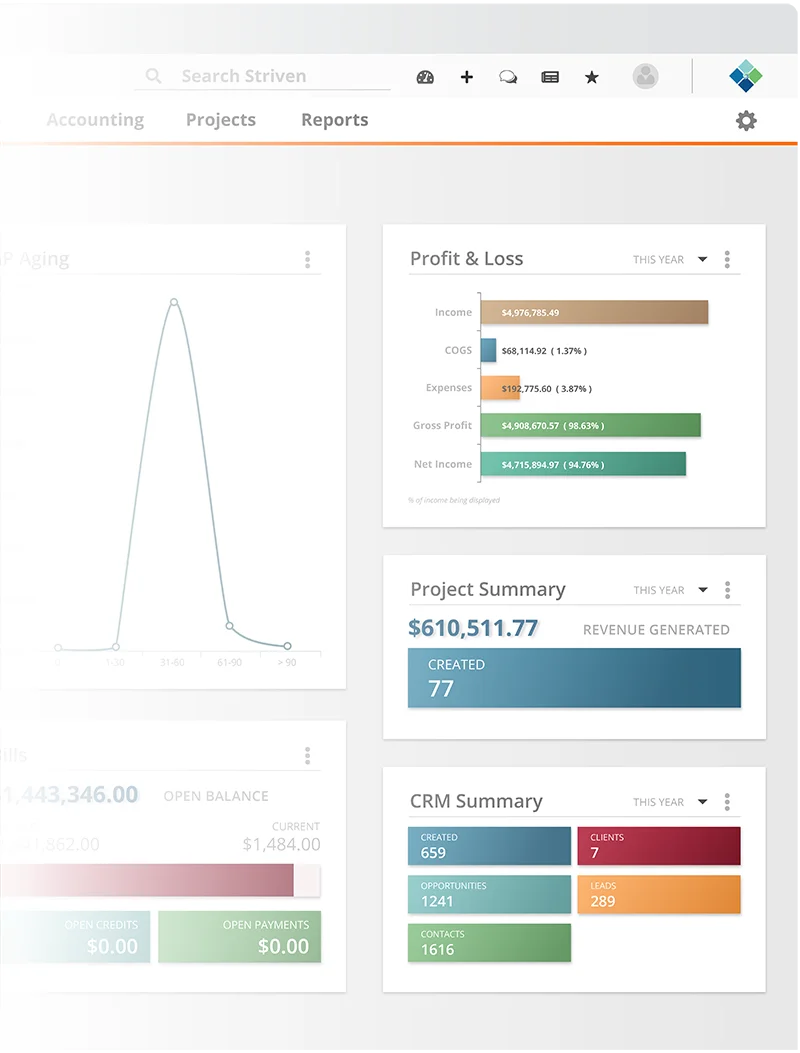
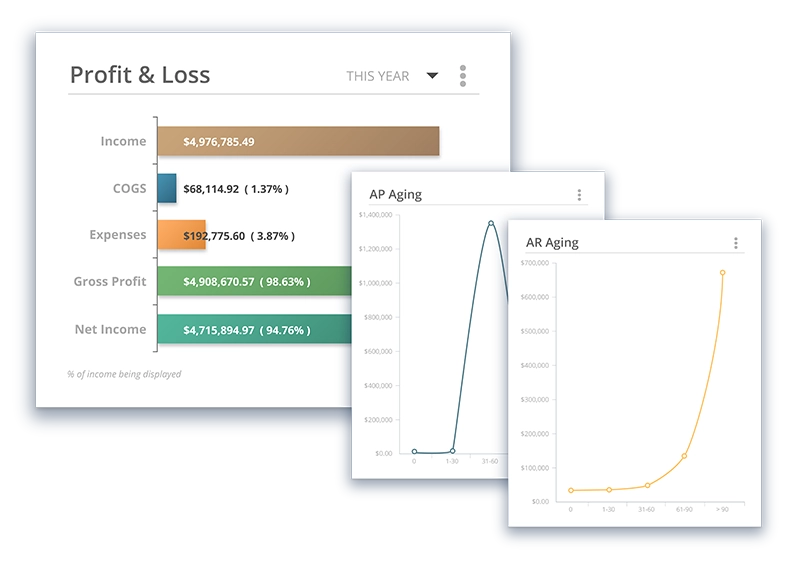
Financial Reporting
Consolidate your data and get real-time insights.
Easily digestible financial data supports informed decision-making, ultimately fostering financial stability and growth.
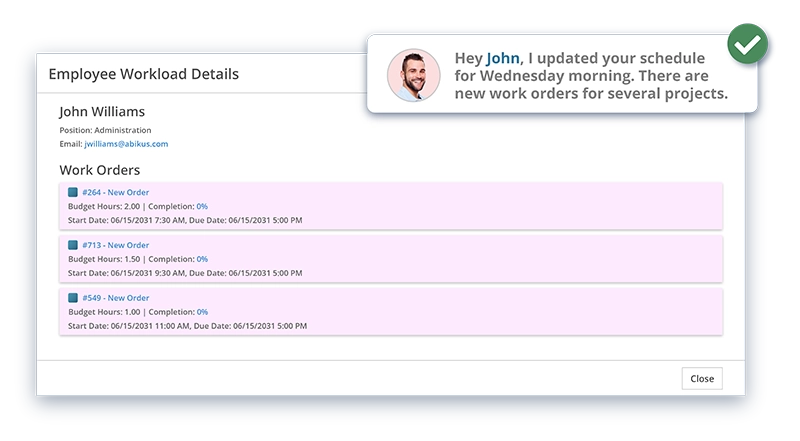
Service and Work Reporting
Transform your workflow management, eliminate inefficiencies, and enhance productivity.
Get a clear snapshot of your operations and watch your business thrive as you stay in tune with your customers and employees in the field.
Sales Reporting
Never miss an opportunity.
Leverage detailed sales reports to identify trends, optimize processes, and supercharge your team’s performance.
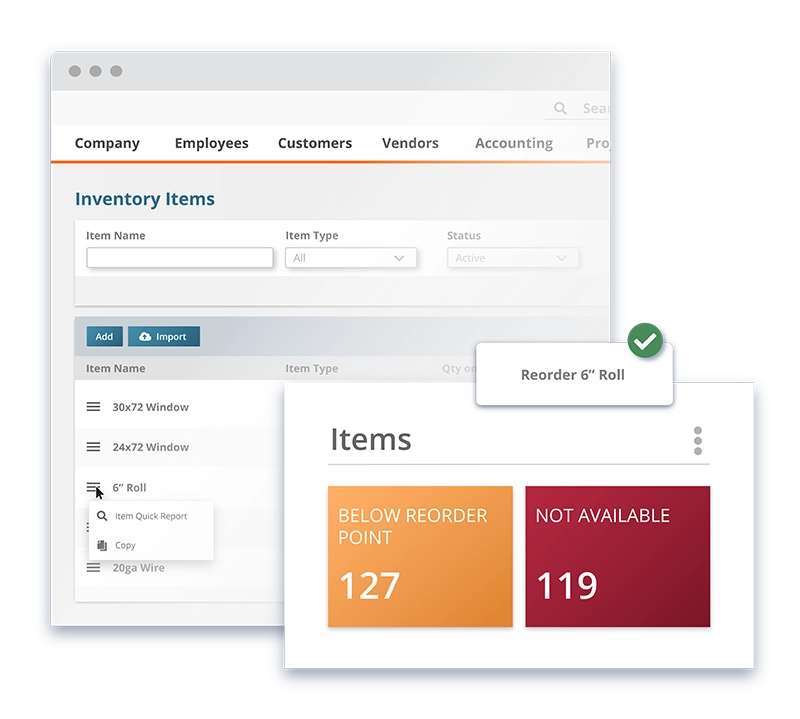
Inventory Reporting
Bring real-time accuracy to your stock management, eliminating discrepancies and preventing overstock or stockouts.
By optimizing warehouse operations, you can better analyze sales trends and patterns which enables precise forecasting and smarter purchasing decisions.
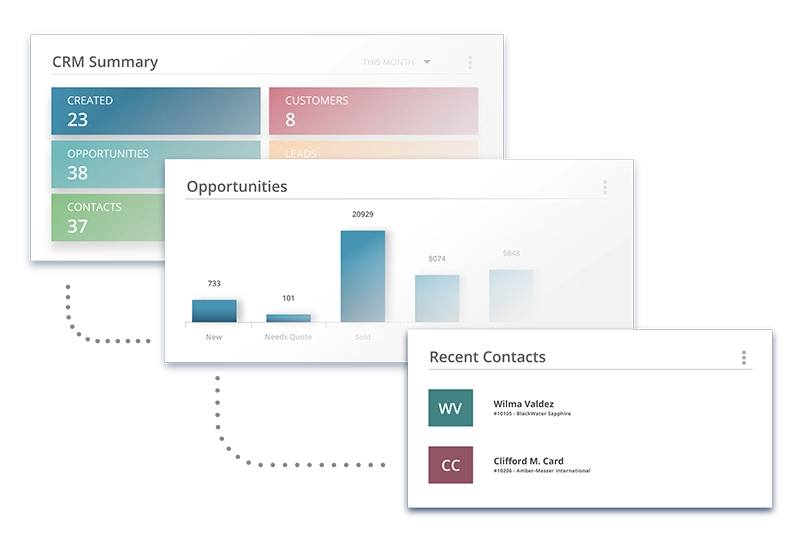
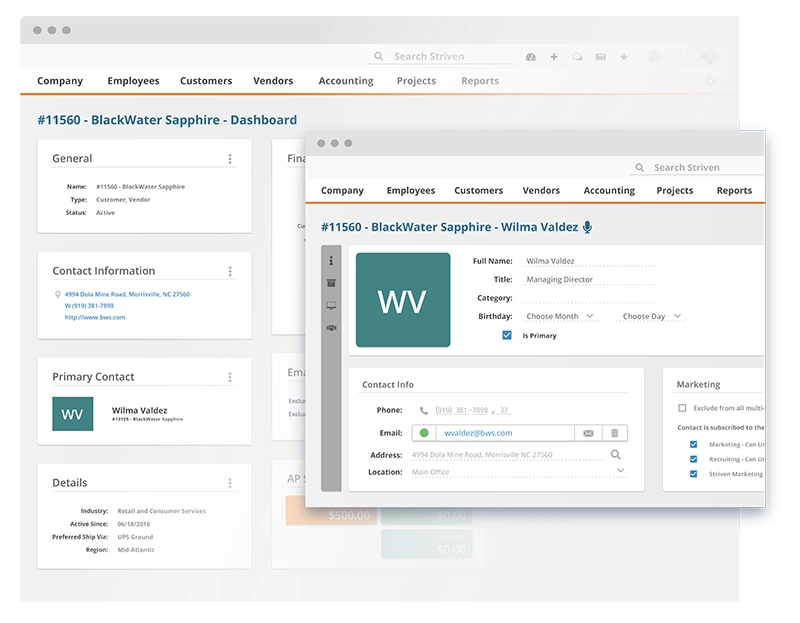
CRM Reporting
Striven’s CRM reporting provides your business with a holistic view of each customer, tracking interactions, preferences, and history.
Enrich customer relationships through data-driven insights, enabling your business to offer personalized and highly responsive service that leads to improved customer satisfaction and loyalty.
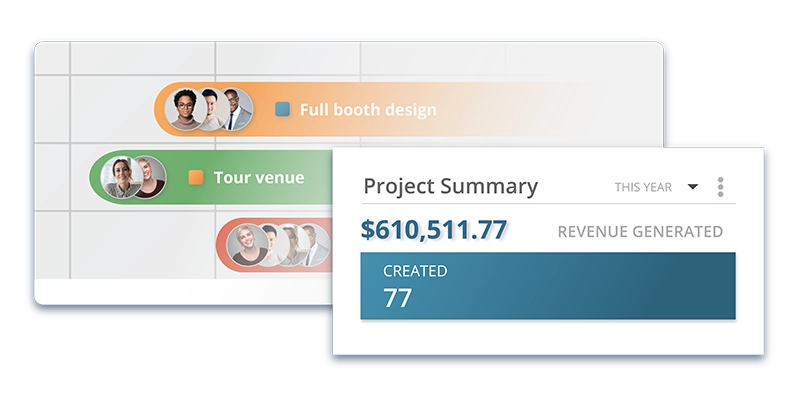
Project Reporting
Striven allows teams to maintain enhanced project oversight, fostering a culture of consistently meeting deadlines and proactively identifying bottlenecks.
Data-rich insights, resource allocation tools, risk management assessments, and performance evaluations propel productivity and ensure successful projects.

Find Success With Striven
Discover how companies like yours have overcome operational challenges and achieved real, measurable results.

“I can run reports and really understand all the parts of the whole together.”
—Kim M., Business Owner
Ready to try it? Start here.
Frequently Asked Questions
-
What is Striven’s Report Builder?
+
The Report Builder is a tool that allows users to create and run detailed reports to monitor and share important information from your Striven system. You can build custom reports using datasets including tasks, transactions, customers, and more.
-
What are datasets and which ones are available?
+
Datasets are the foundation for your reports and include Tasks, transactions, Customers, and more. Each dataset has its own set of filters, columns, and relationships.
-
Can I use custom field data in my reports?
+
Yes, filters and columns can include Custom Field data as well to help provide as many helpful options as possible.
-
What if I’m unsure which dataset to use?
+
You can utilize the Dataset Lookup feature by clicking on the hyperlinked “Look up by Columns, Filters” text located next to the Based On field when adding a new report. This tool helps you search for columns, filters, and relationships across different datasets.
-
What are Standard Columns vs Computed Columns?
+
Standard Columns contain and organize the data that will be generated by the report parameters. Computed Columns allow you to add columns which use mathematical formulas related to columns on the report that contain quantitative data.
-
How do filters work in reports?
+
Filters can be used to narrow the field of data your report will display by opting to include or exclude specific data. You can choose filter types including Where (shows all results for selected filters), Where Either (shows filters selected and others), or Excluding (excludes results matching the filters selected).
-
What sorting and grouping options are available?
+
Sorting will determine how the report data is displayed when run, and you may choose to have your data arranged by up to 3 columns. Grouping will automatically organize report data based on related data from selected columns into expandable and collapsible sections.
-
Can I export my reports?
+
Yes, Custom Reports can be exported to .CSV, .PDF, and .XLSX file types. You can export your report by selecting the Export button from the Report Actions bar, then choose your preferred file type from the drop-down menu.
-
What is the “Map It” feature?
+
The Map It feature is available on reports that contain geographic information. It allows you to view report data as pins on a map, providing a visual of all the results in a specific area.
-
Can I customize the appearance of exported reports?
+
Yes, Striven offers customization to your exports by allowing you to configure Custom Report Header Formats. These formats function similarly to Invoice and Task Formats by using HTML to style your header.
ERP Reporting: Your Gateway To Success
By consolidating data into a single, accessible platform, Striven offers real-time, comprehensive insights into every business operation. What are you waiting for?